Visualize Your Income. Grow Your Business.
Do you ever feel like this?
- “I don’t know how much I actually earned this month…”
- “Sales are increasing… but I’m not sure if I’m making a profit”
- “Everything is scattered, and I can’t see the full picture”
If that’s you, you’re not alone.
Many freelancers and small business owners manage expenses…
but don’t properly manage sales.
And that’s the real problem.
Why Sales Management Matters
A budget tells you:
Where your money went
But a business needs to know:
How your money is growing
Without sales management, you can’t:
- Understand which products or services are profitable
- Track your monthly income trends
- Make confident business decisions
That’s why I created this:
A simple Sales Management Template designed for clarity
What Is This Template?
This is a spreadsheet template that helps you:
- Track sales by product or service
- Monitor monthly revenue trends
- Calculate profit more accurately
Instead of guessing, you’ll finally be able to:
- See your business clearly
- Understand your numbers
- Make intentional decisions
Key Features
1. Sales Tracking by Category
You can record income based on:
- Product
- Service
- Project
This helps you identify:
What’s actually making money
2. Monthly Sales Visualization
Your sales are automatically organized by month.
So you can:
- Spot trends
- Compare performance
- Adjust your strategy
No more “I think I did well this month…”
3. Profit Awareness
Revenue alone doesn’t tell the truth.
This template allows you to:
- Connect sales with expenses
- Understand real profit
Because:
Sales ≠ Income
Profit = Reality
Why This Template Works
Most systems fail because they are:
- Too complicated
- Too time-consuming
- Hard to continue
This template is different.
It’s designed to be:
- Simple to input
- Easy to review
- Clear at a glance
So you can focus on:
Growing your income, not managing spreadsheets
How to use the Sales Management Template
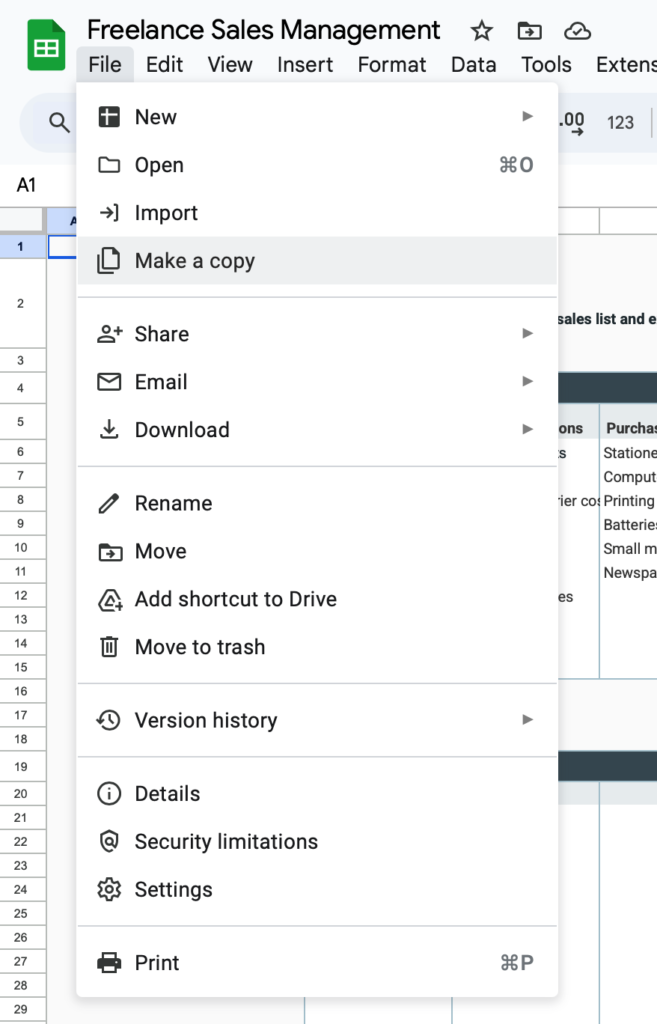
Download and save a copy
This file is for viewing only.
Please make a copy first before use.

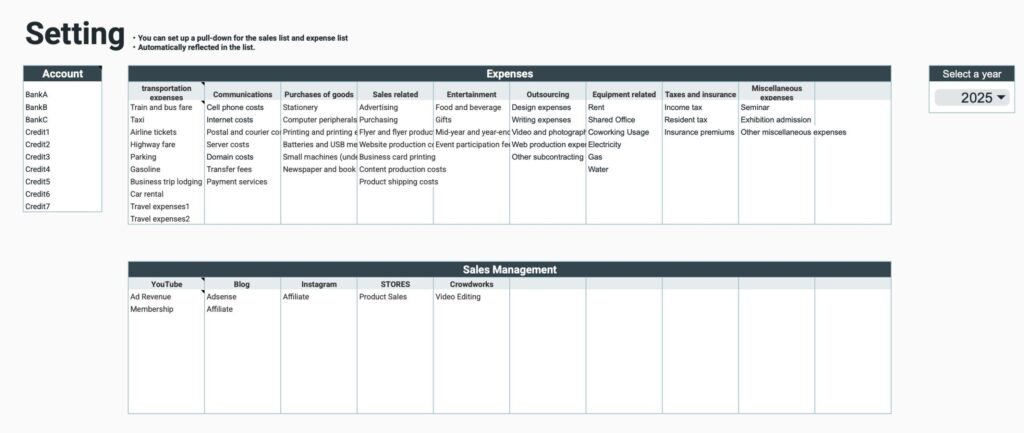
Setup sheet
Setup
- Account Name
Enter the account for withdrawals and deposits - Expense Categories
Categorize into large and small categories - Sales Management
Categorize into large and small categories - Select the year
Select the year from the tab
Sales Management should be arranged by platform, client, product, etc.
Use one file per year.
Please select the year to be used.
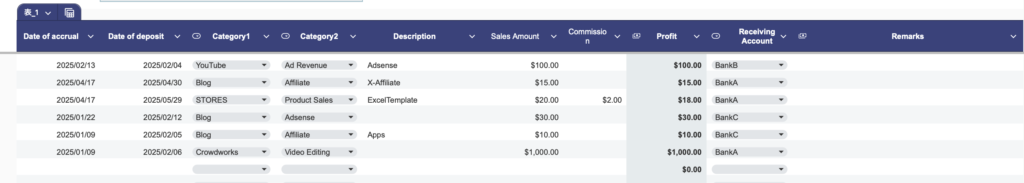
Sales list
In the Sales List, enter the sales amount by date.
Input items
- Date of Occurrence - select from calendar
- Date of Deposit - select from calendar
- Large Category-Select from tab
- Small Category-Select from tab
- Description
- Sales Amount
- Commission (blank if not generated)
- Receiving Account-Select from tab
- Notes
Profit is an automatically calculated item.
Profit = Sales amount - Commission
Slicer
You can use the slicer function to display specific items.
Slicer items
- Months of origination
- Months of deposit
- Large categories
- Small categories
- Receiving accounts
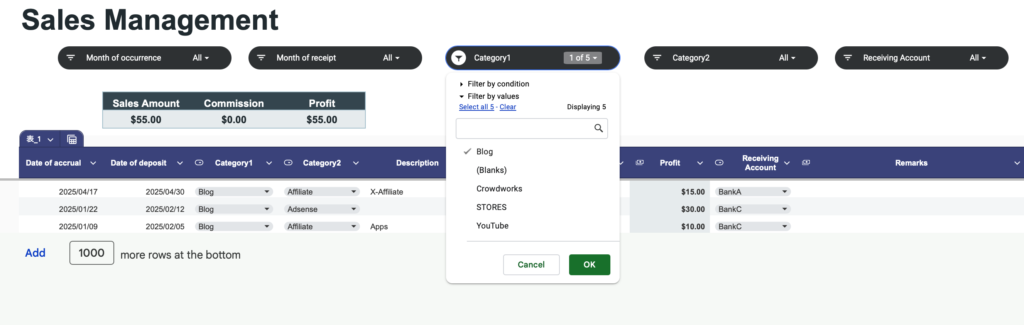
Show total number and total amount
Show totals at the top of the list
Display items
- Sales amount
- Commission
- Profit
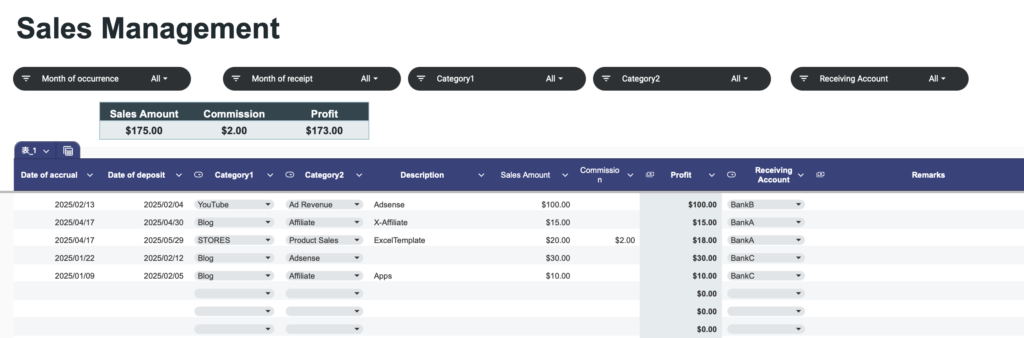
When a particular item is displayed in the slicer, the total of the displayed items is shown.
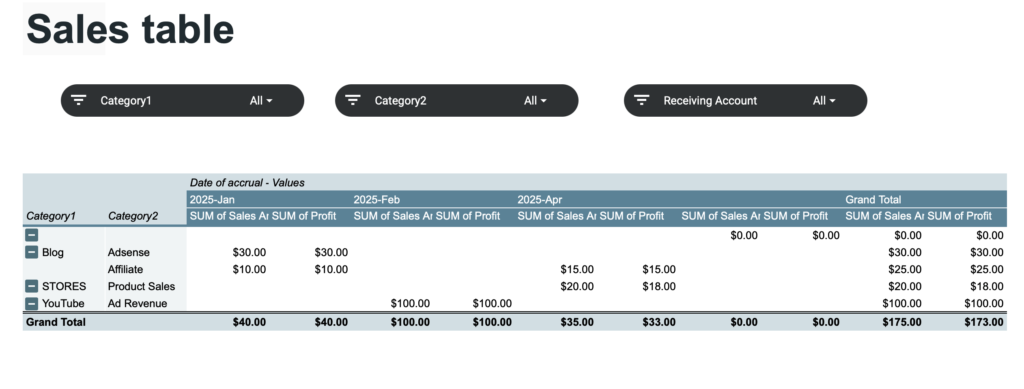
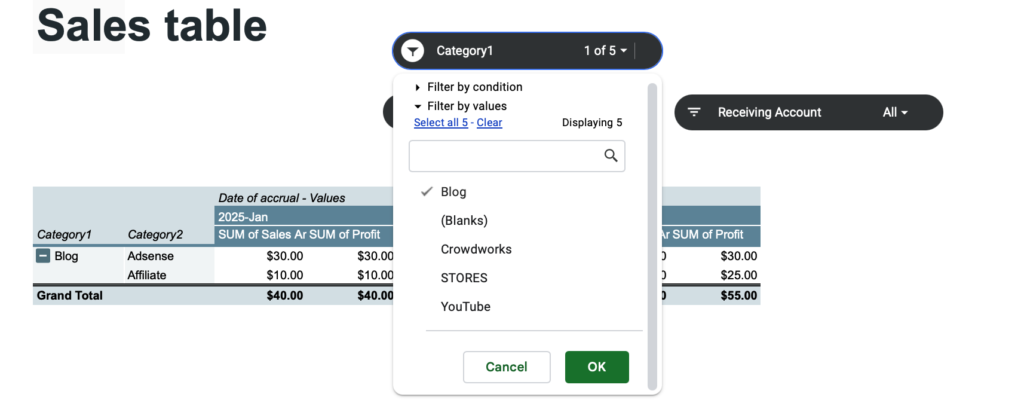
Sales table
Displays sales and profits by month and category based on sales list data.
The slicer function can also be used to display only specific items.
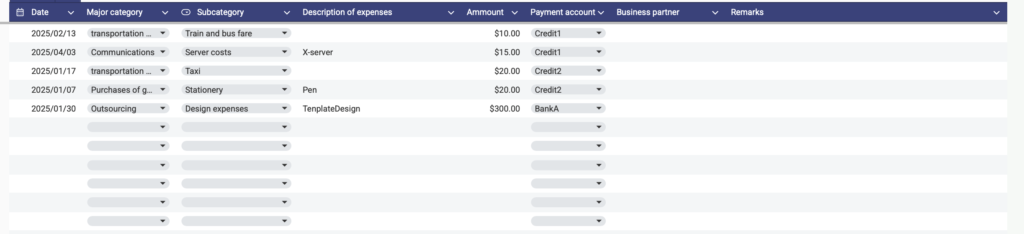
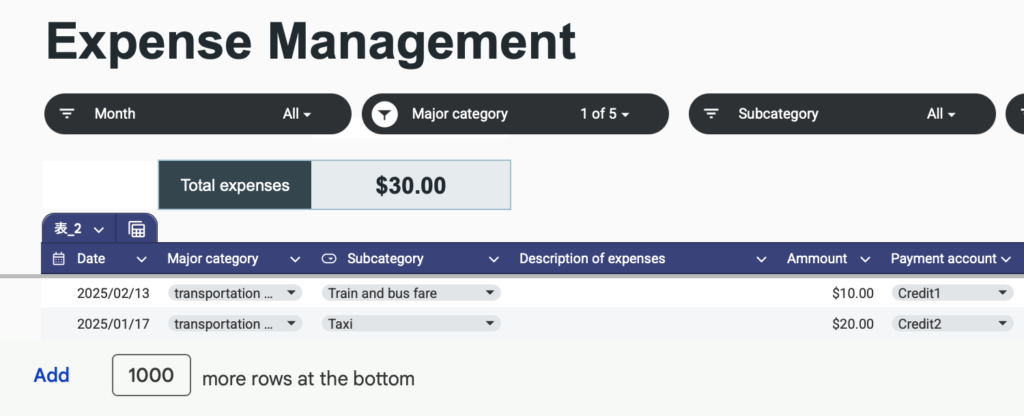
Expense list
In the expense list, enter expense amounts by date.
Input items
- Date - select from calendar
- Large category-Select from tab
- Small category-Select from tab
- Expense description
- Expense amount
- Payment account-Select from tab
- Business partner
- Notes
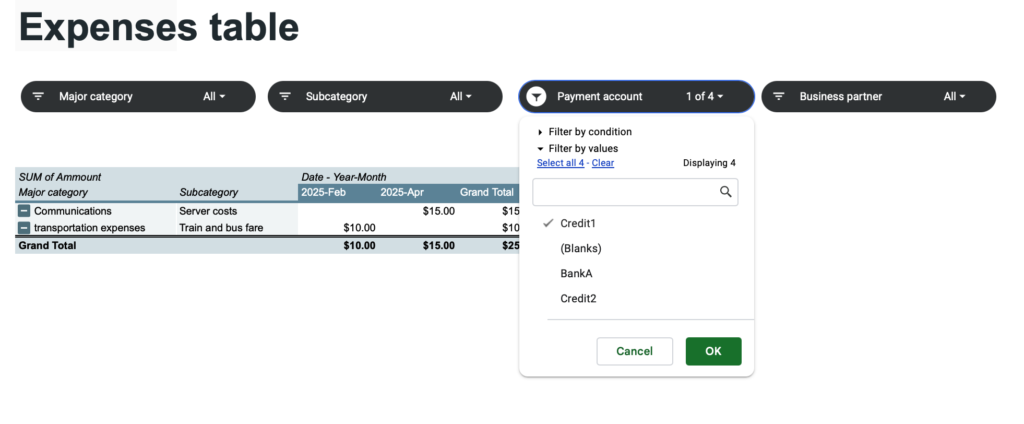
Slicer
You can use the slicer function to display specific items.
Slicer items
- Month
- Large category
- Small category
- Receiving account
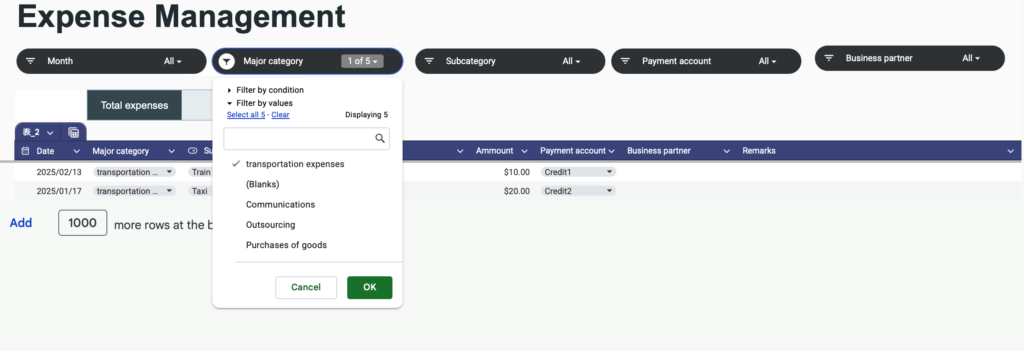
Show total amount
Total expenses are displayed at the top of the list.
When a particular item is displayed in the slicer, the total of the displayed items is shown.
Expense table
Displays expense amounts by month and category based on expense list data.
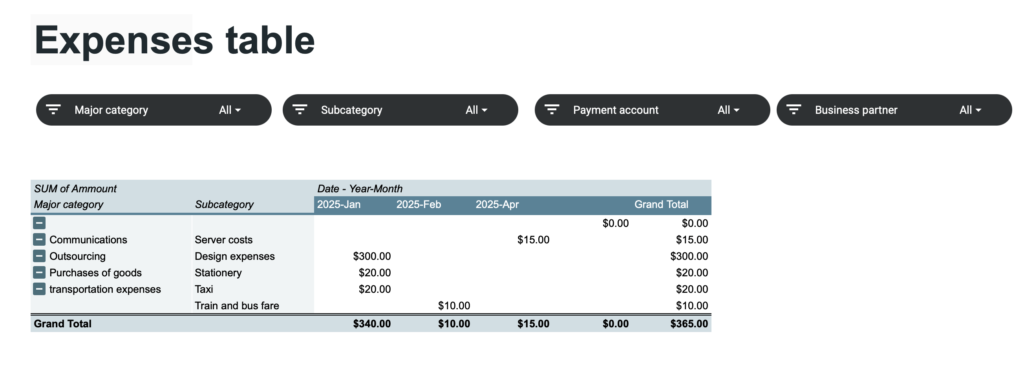
The slicer function can also be used to display only specific items.
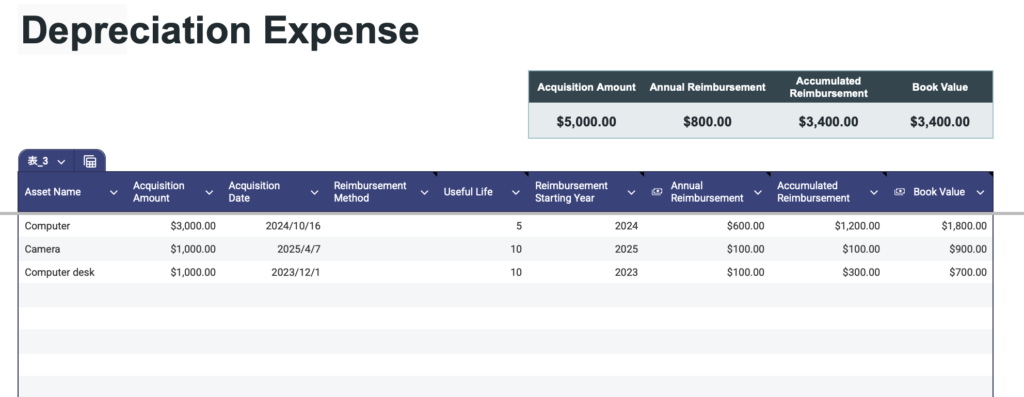
Depreciation sheet
Input items
- Depreciation is the process of allocating the cost of a tangible asset over its useful life.
- Asset name
- Acquisition amount
- Acquisition Date
- Depreciation Method: The method used to depreciate the asset (e.g., Straight-Line, Declining Balance).
- Useful Life: The number of years over which the asset will be depreciated.
- Depreciation Start Year :The fiscal year when depreciation begins.
- Annual Depreciation: Expense The amount of depreciation recorded each year.
- Accumulated Depreciation: The total depreciation recorded to date.
- Book Value :The remaining value of the asset after depreciation has been subtracted.

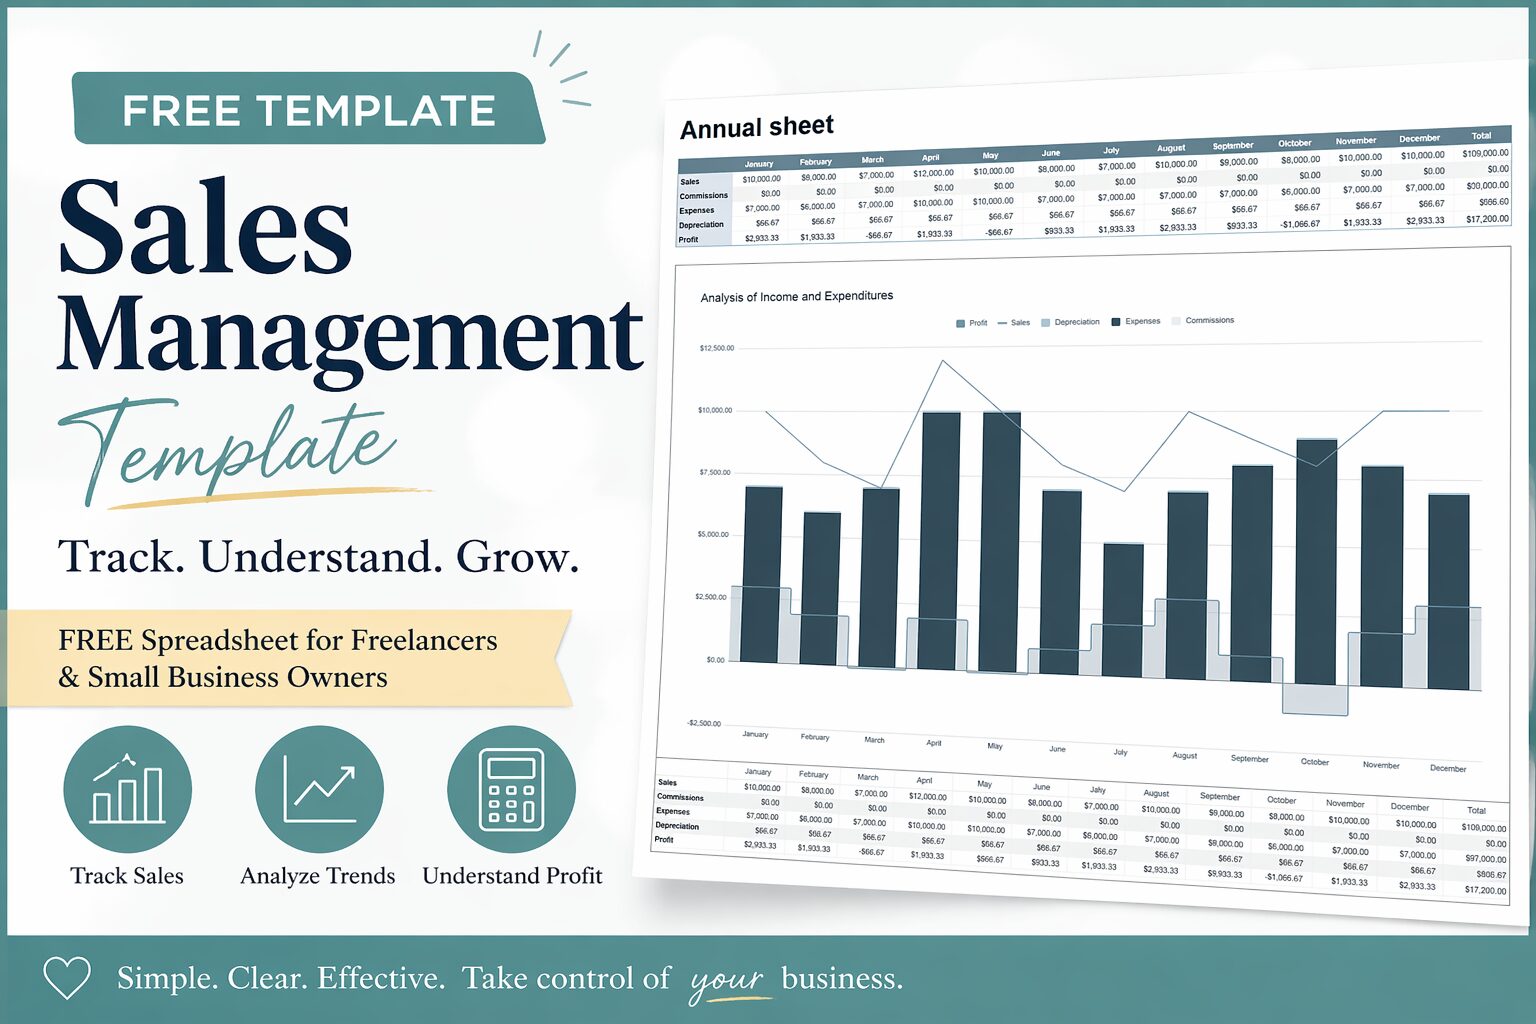
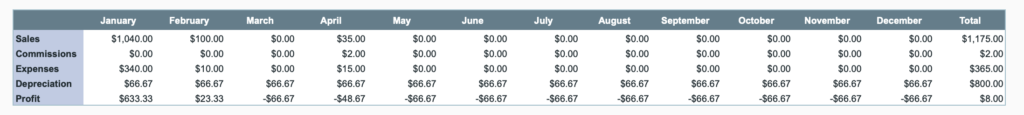
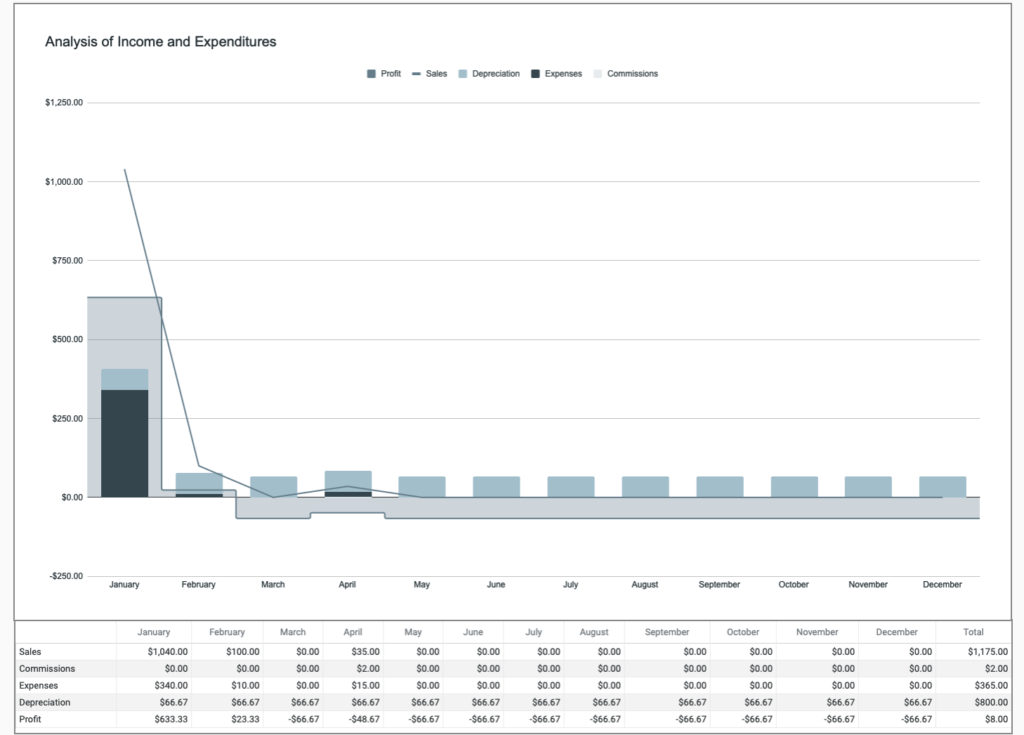
Annual sheet
Annual transition table
Data from the Sales List, Expense List, and Depreciation sheet are displayed by month.
Depreciation is calculated by dividing the total annual depreciation expense on the Depreciation sheet into 12 equal parts.
Profit = Sales - (Commission + Expenses + Depreciation)
Annual graph
Annual tables are displayed graphically.
Sales are shown as line graphs, profits as staircase surfaces, and all other items are shown as reserve graphs.
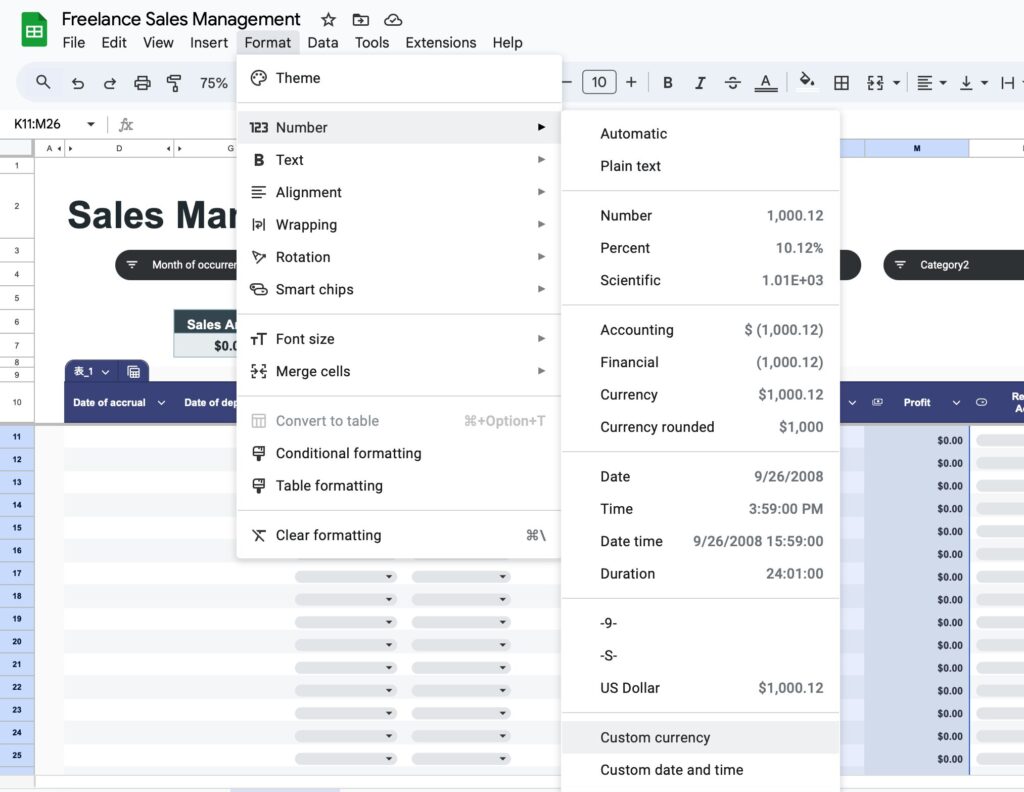
How to change currency units
The default currency unit is the dollar.
To change the currency unit, specify a range, and click Format,Number,Custom currency.
Who This Is For
This template is perfect if you:
- Are a freelancer or self-employed
- Sell products or services
- Want to understand your income clearly
- Feel unsure about your business finances
Free Download
You can download the template here:
Free Sales Management Template
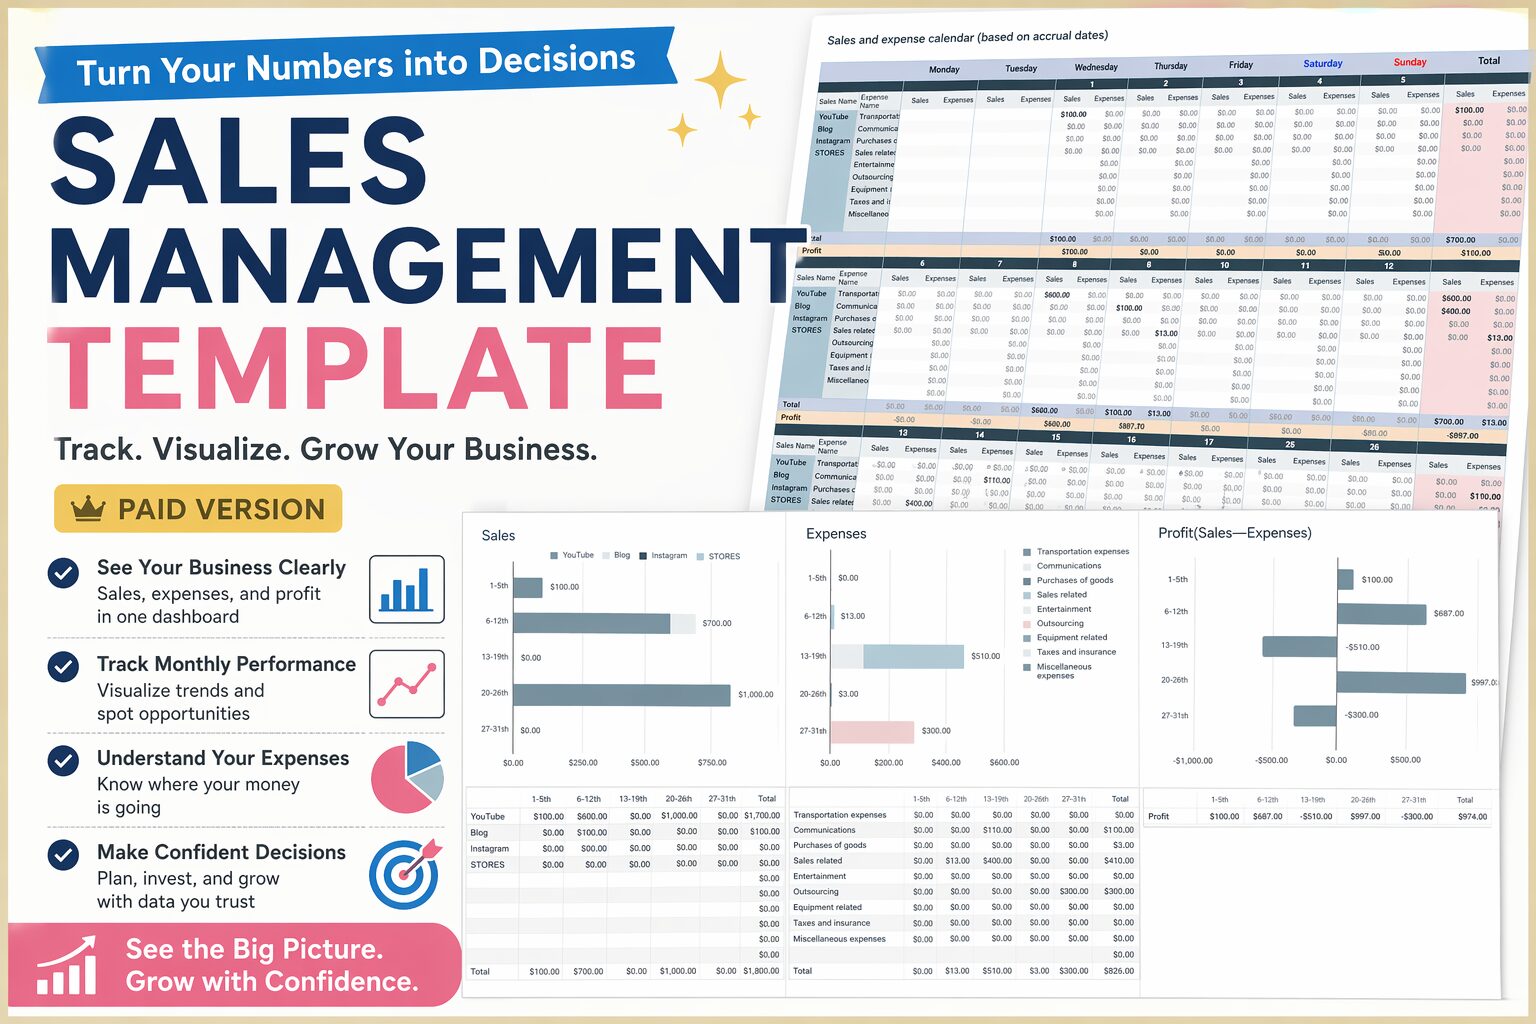
Next Step: Sales Management Template (Advanced Version)
Turn Your Sales Into Strategy
If you're already tracking your sales…
That’s a great first step.
But you might still feel like this:
- “I can see my numbers… but I don’t know what to do next”
- “Sales are growing, but profit isn’t increasing”
- “I want to scale my business, but I don’t have a clear plan”
That’s because:
Tracking alone is not enough
From “Recording” to “Understanding”
The free template helps you:
- Track your sales
- See your monthly income
But the paid version goes further.
It helps you:
- Understand your business
- Make decisions with confidence
- Grow your income intentionally
-
-
Sales Management Template (Paid Version)|Take Full Control of Your Income & Business
Do you feel like you're managing your income… but still unsure about your finances? If this sounds familiar, you’re not alone. The problem isn’t your ...
続きを見る
Final Thoughts
Money anxiety doesn’t come from “not enough money.”
It comes from:
Not seeing your money clearly
This template helps you:
- Visualize your income
- Understand your business
- Build a sustainable future
Because money is not just numbers.
It’s a tool to design your life.