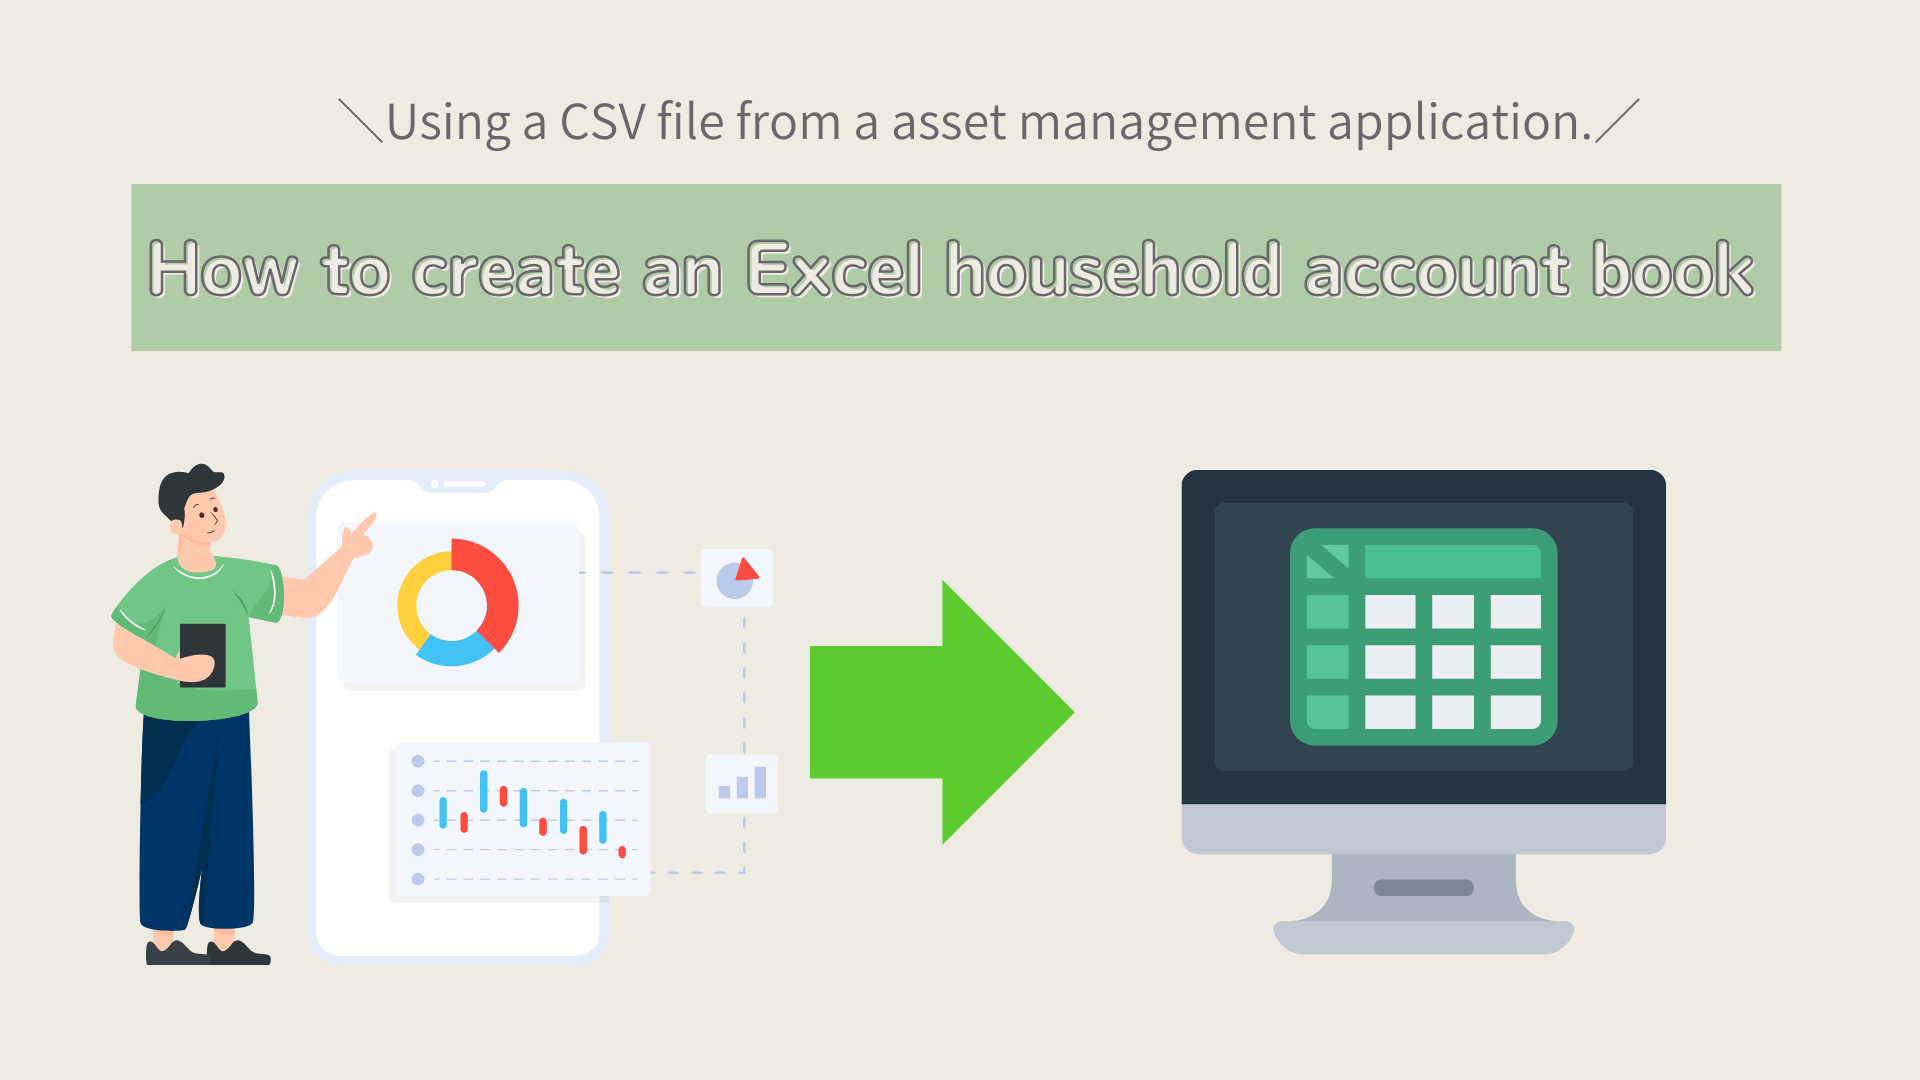

I am not able to utilize the CSV file of the asset management application.
I don't know how to create an Excel household account book from a CSV file.
Do you have such a problem?
While an asset management application is sufficient to look back on your finances, an
Excel household account book allows for deeper analysis.
This section provides instructions for creating an Excel household account book using CSV data from an asset management application.
A sample template (free download) is provided for easier creation, so please make use of it.
Advantages of creating an Excel household account from a CSV file
- The Excel household account book is easier to view with larger images than on a smartphone.
- Once a format is created, it is easy to update the data when the month changes.
- The monthly list of household account transitions is easy to view.
- At the touch of a button, you can change from daily to monthly data.
- Pinpointing the transition of specific items, such as utility expenses, can be shown in a table and graph for easy analysis.
Steps to create an Excel household account book
- Download the CSV file from the household accounting application.
- Paste the data into a new Excel file.
- Create a pivot table based on the data.
- Create a pivot graph.
- Download the CSV file of the previous month when the month changes.
- Paste the data to the continuation of the data in (2) Excel.
- Update the pivot table.
How to create an Excel household account book
Download CSV file
Please download csv or excel data from the asset management application website.
Please check the availability of csv data and how to dump it from the app's homepage.
I cannot log in to the foreign asset app in Japan, so I could not find out how to download the details.
Paste data into Excel
Paste the data into a new Excel file. (If you downloaded the Excel data, you do not need to paste it.)
Save the new Excel with a name.
Sample
Process data
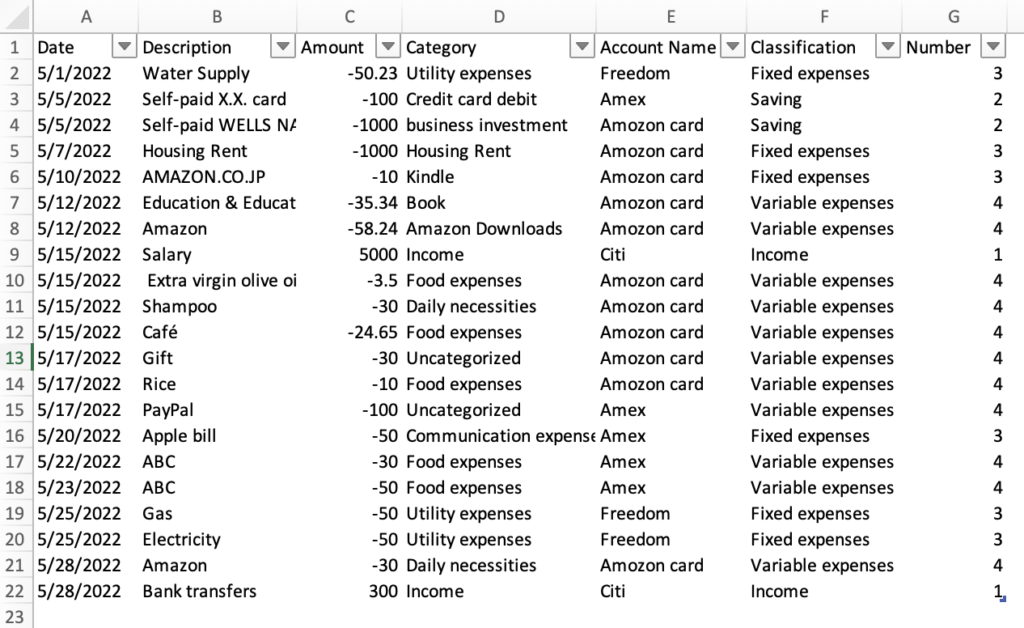
The data can be used as is, but for better visibility, categorize it.
Select the household data and enter Income, Savings, Fixed Expenses, and Variable Expenses in next to last row.
Since this is hard work, the sample template allows you to convert the numbers as you enter them for easy entry.
Delete any data you do not wish to include in the calculation.
This item is for withdrawing cash from a bank account or transferring funds from an account to a credit card debit.
They are not included in the household account calculations because they represent a double use of money.
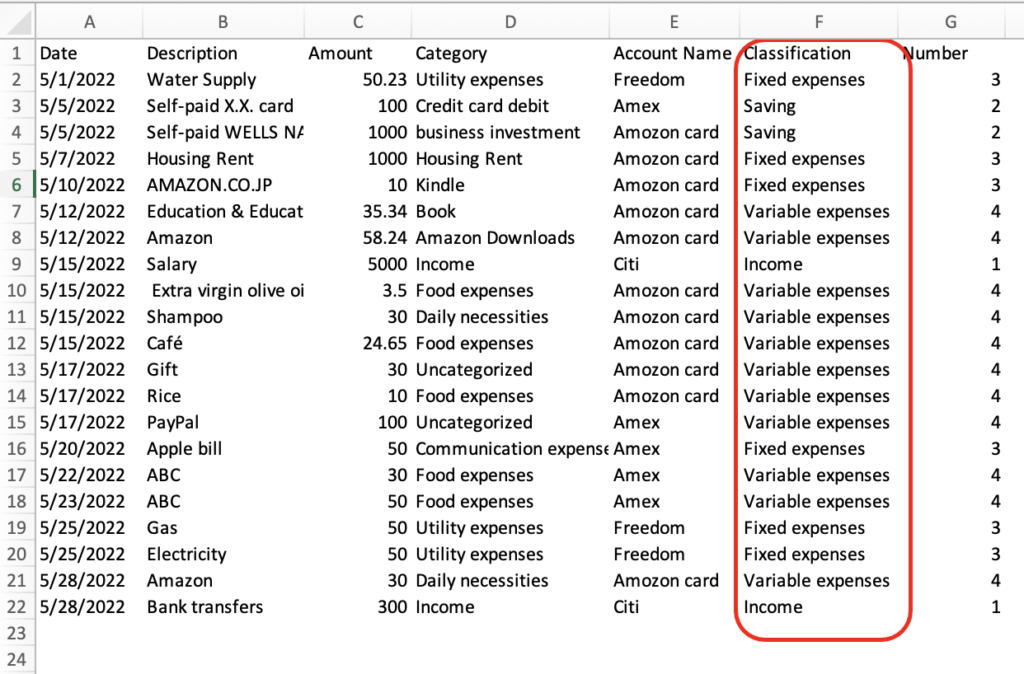
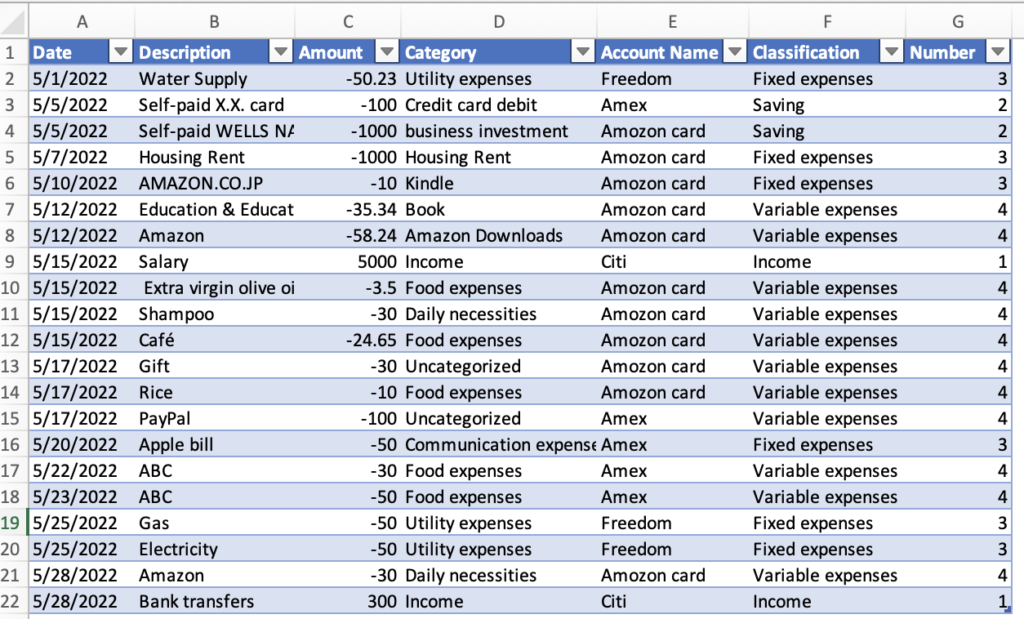
After classifying the data and deleting the credit card debit items, convert the data into a table.
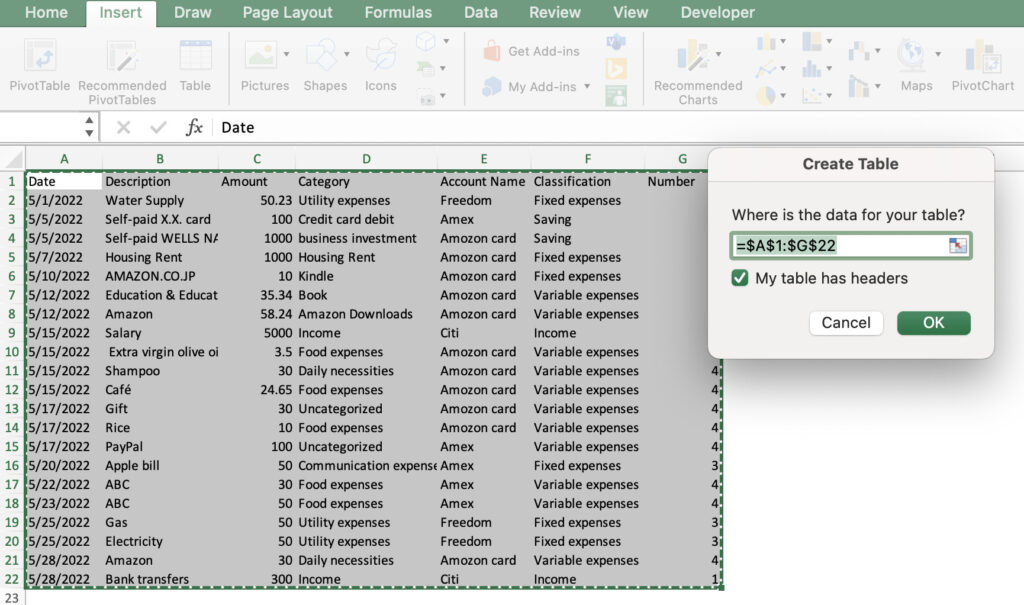
By doing this, the household account book will be automatically updated by simply clicking the "Update button" when more data is added.
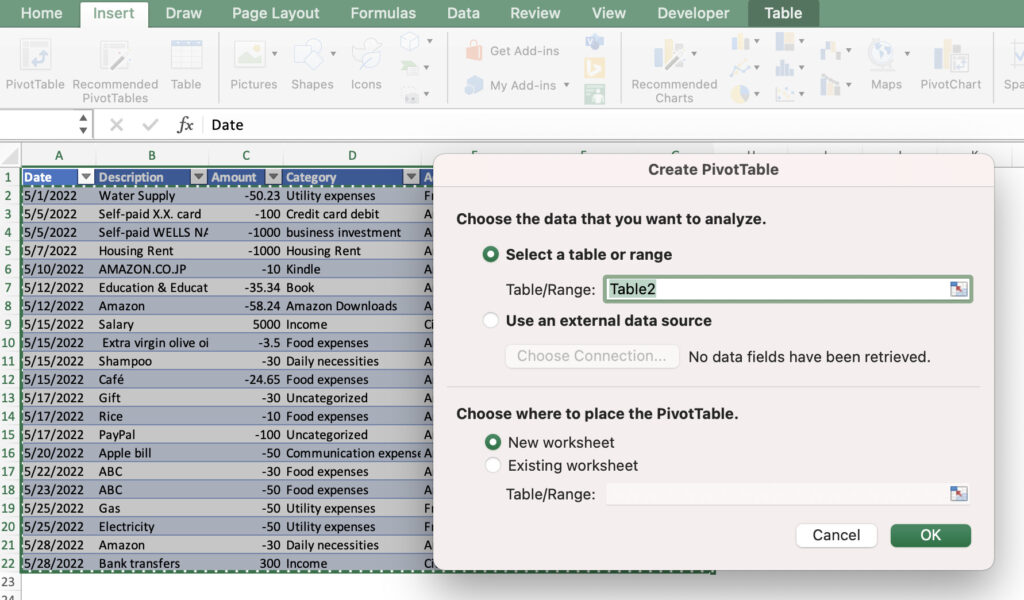
Select all data and insert data, click on the table, check "My table has headers," and click the OK button.
Table
Create Pivot Tables
A pivot table is a table that allows you to analyze and tabulate large amounts of data without using any functions.
Insert, select Pivot Table, select the range of the table, select a table or range, select a new worksheet, and click on the OK button.
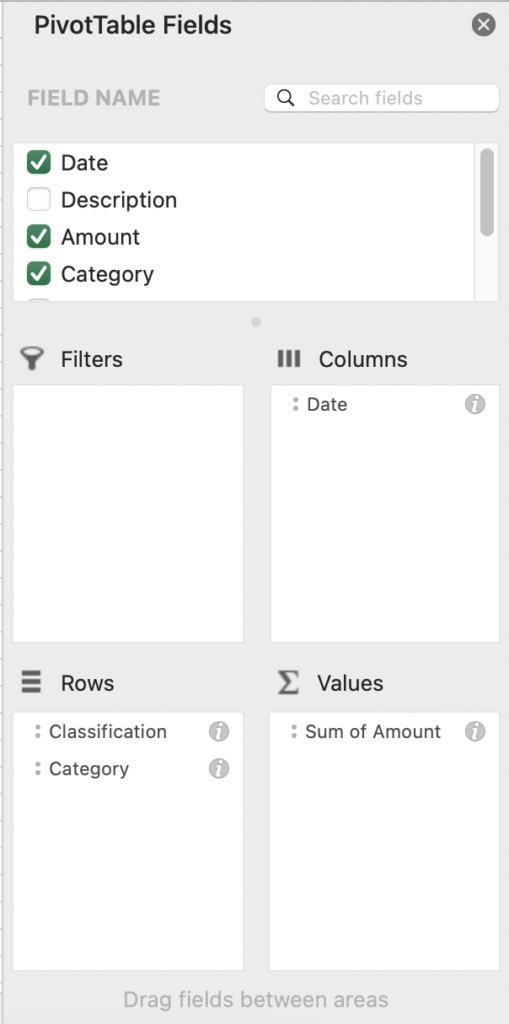
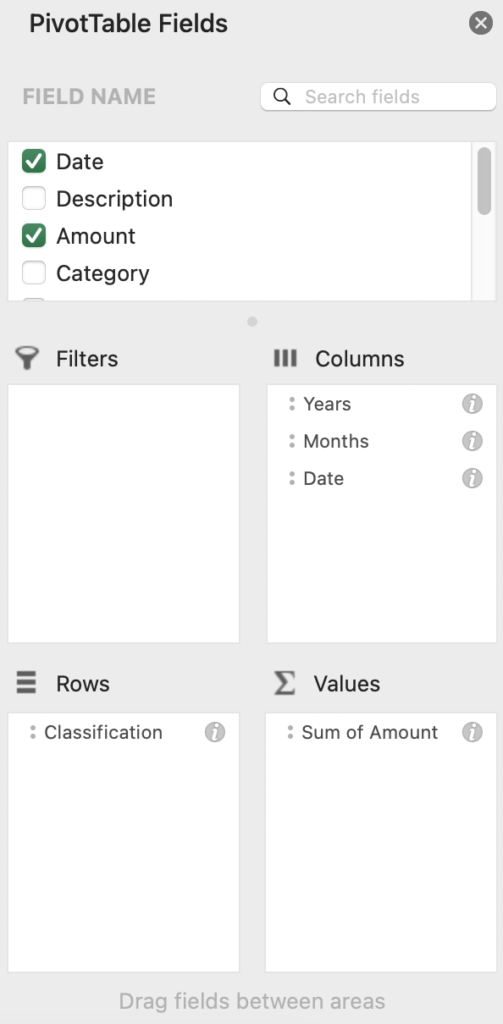
The fields of the pivot table will appear on the right side of the new sheet.
The table placement is determined from the field name column.
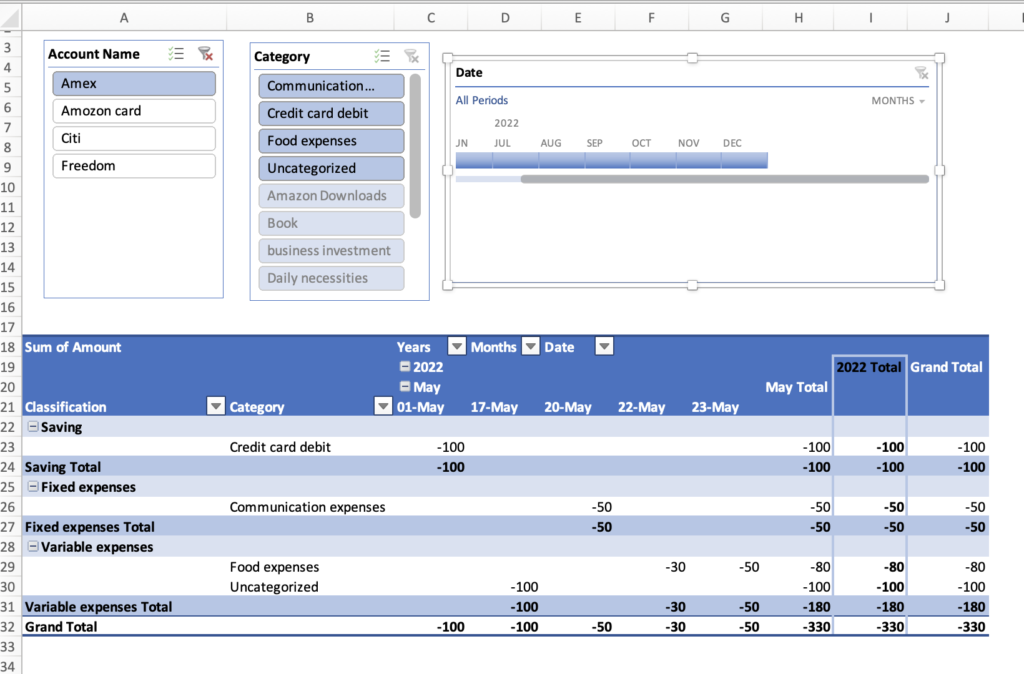
- Column: Date
- Row: Classification,category
- Value: Amount
Drag to the respective field columns to achieve the above arrangement.
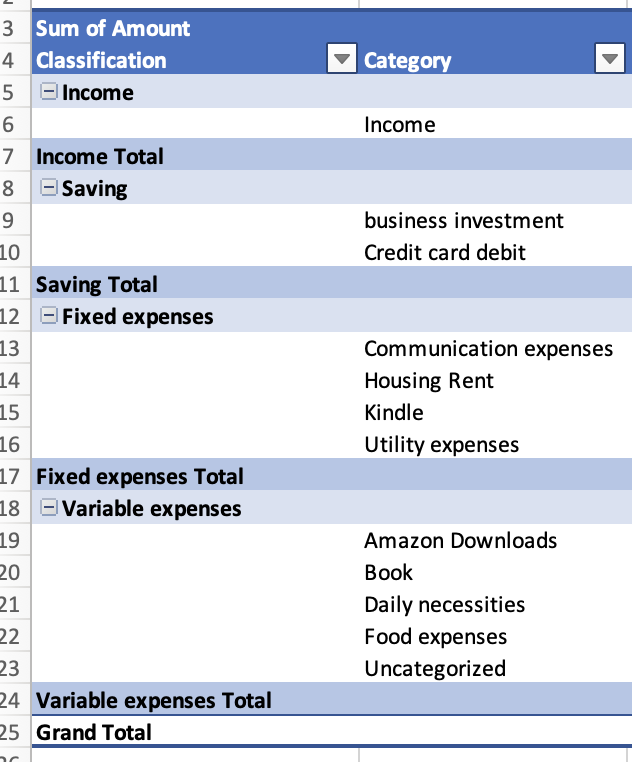
The following table appears when placed in the classification method above.
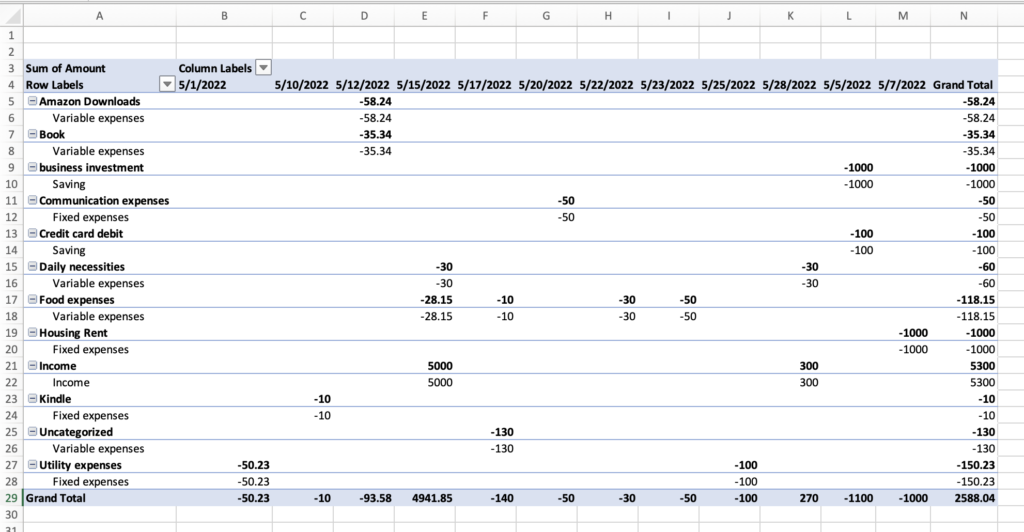
This table is not easy to analyze and understand at a glance, so we will change it to make it easier to read.
Modification
- Addition of tabulation
- Change the layout of the table
- Change the order of income, savings, fixed costs, and variable costs
- Change the design of the table
- Change date to monthly
- Add slicer
Add tabulation points
Click anywhere in the Pivot Table and you will see the items "Pivot Table Analysis" and "Design" at the top.
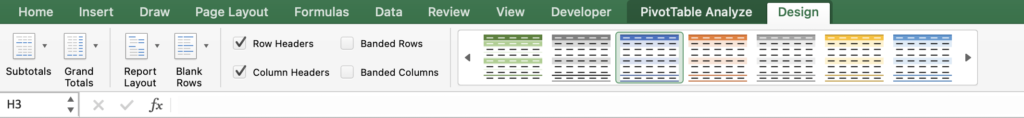
Select "Design
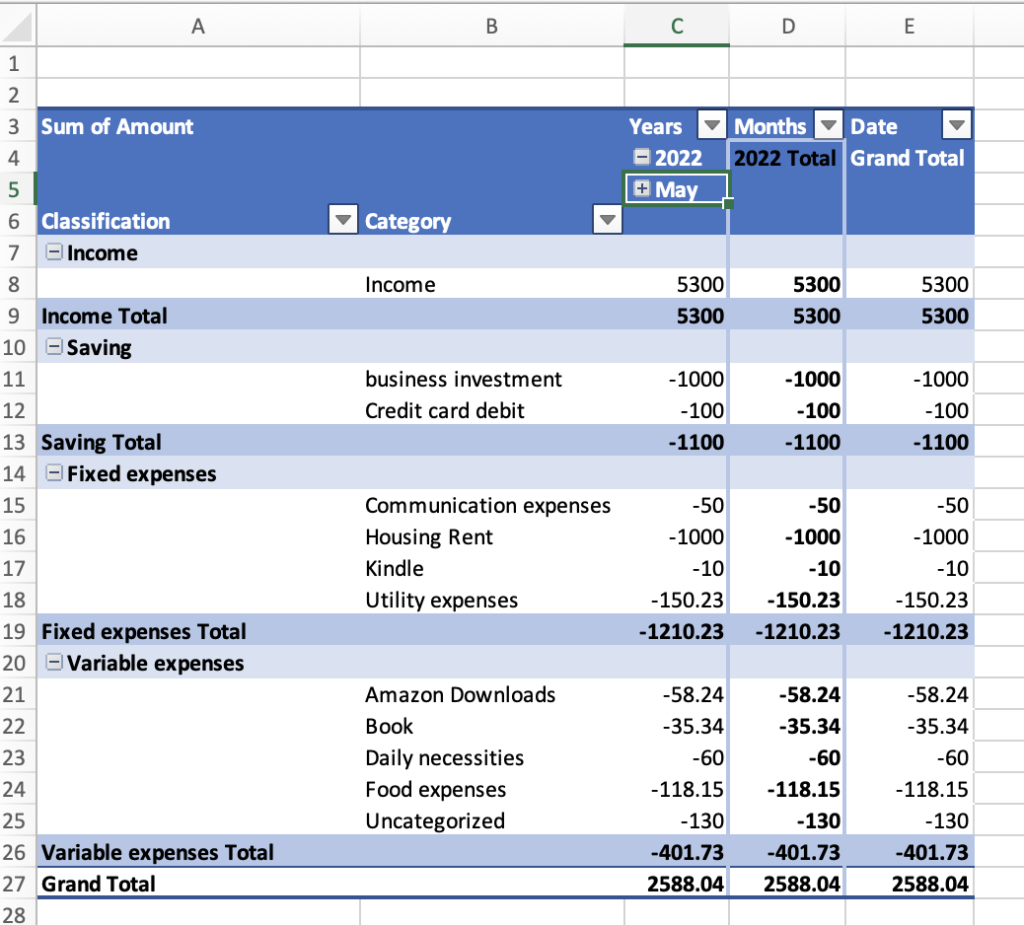
- Subtotal - Show all subtotals at bottom of group
- Grand Totals - On for rows and columns
Subtotals - displays totals for income, savings, fixed expenses, and variable expenses
Grand Totals - displays daily income and expense totals and monthly totals
Changing the Table Layout
Select the Report layout and click on "Show in outline form"
The single-column display is now two columns, which is much easier to see.
Change the order of Income, Savings, Fixed Expenses, and Variable Expenses
Click and drag the cell containing the Income, Savings, Fixed Expenses, and Variable Expenses categories to move them up or down.
You can move the cell when the hand symbol appears at the top of the cell. (In Windows, the + symbol)
Change the table design
Select table style from Design
Change Date to Month
Change the date from a day-by-day view to a month-by-month view.
Right-click on D3 and click "Group by
Click on Day, Month, Year and OK (hold down Ctrl key while selecting)
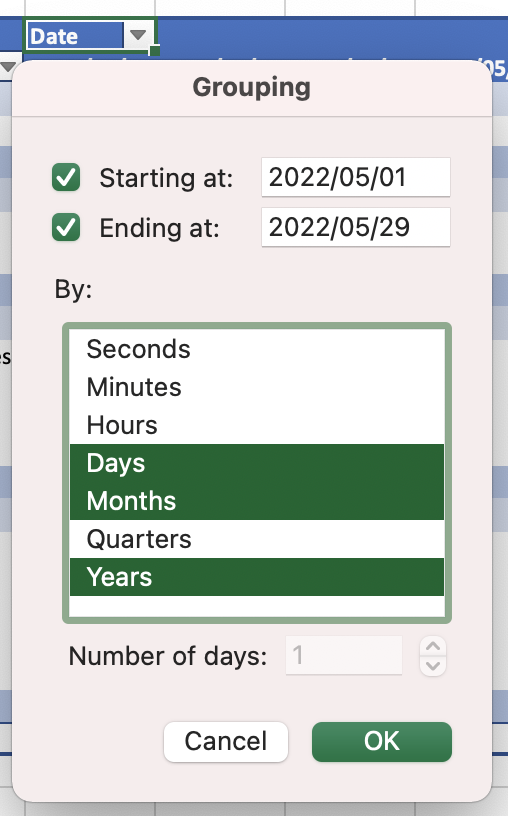
The items "year" and "month" have been added next to the date.
Click the button to the left of the month to change it to monthly or daily.
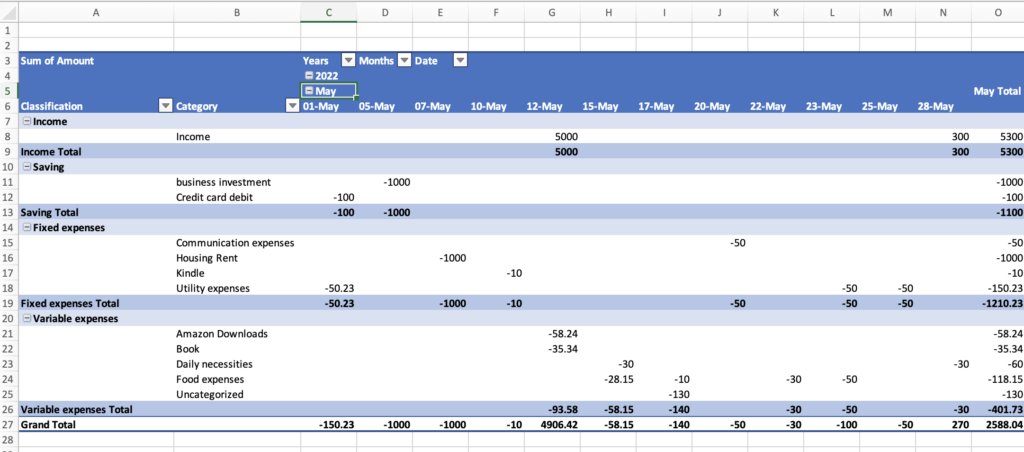
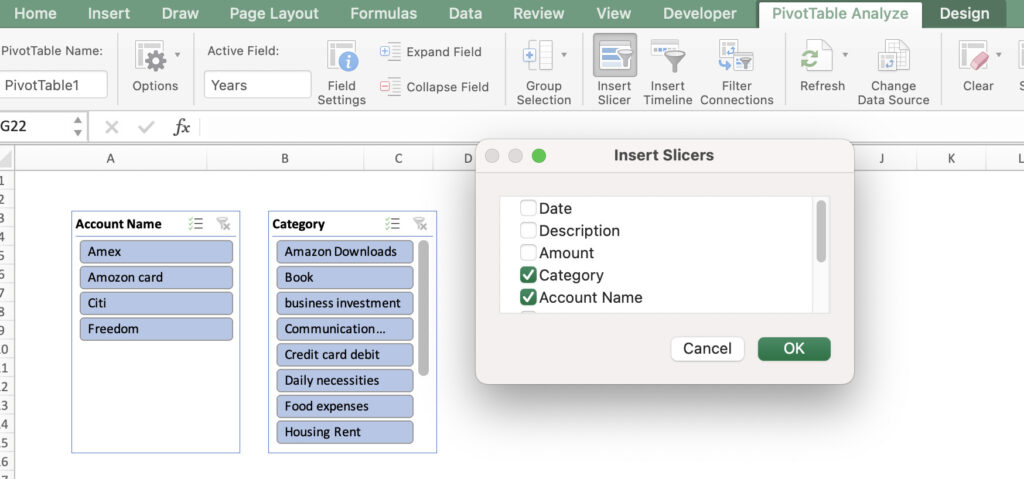
Add Slicer
A slicer is a function that allows you to view trends in certain expenses, such as utilities, or to view income and expenses for a specific account.
Click on Pivot Table, select Pivot Table Analysis, and click on "Insert Slicer".
Check the items you wish to analyze and click OK.
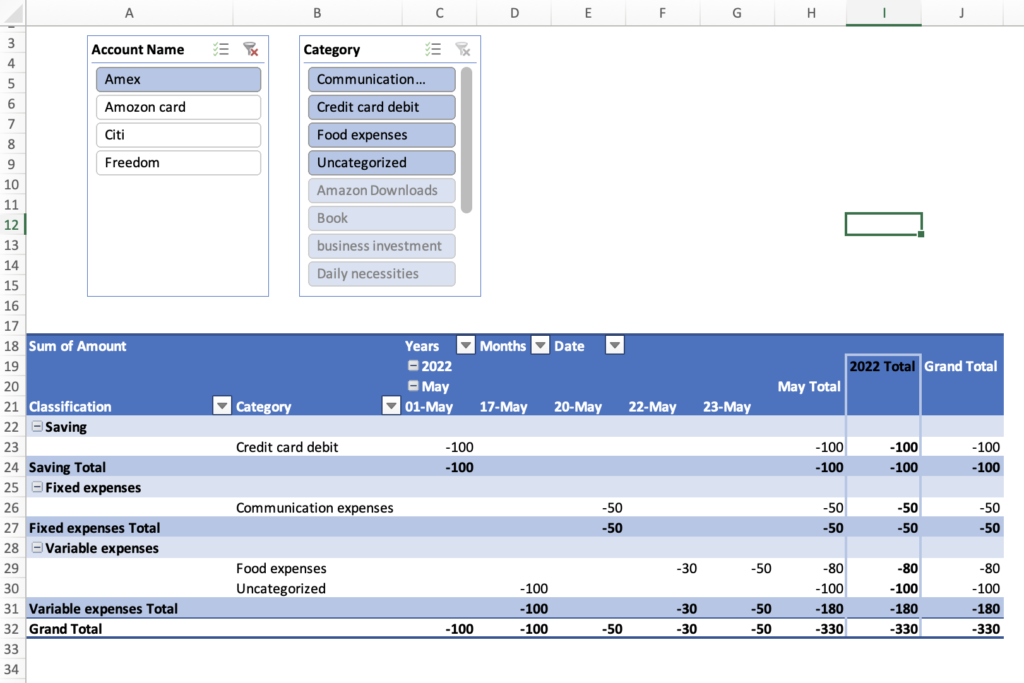
Click on the item you are interested in to see the transition amount for that item.
To undo the change, click on the faction mark in the upper right corner.
Add a timeline in the same way.
Click on Pivot Table, Pivot Table Analysis, click on "Insert Timeline".
Check the dates and click OK to display the timeline.
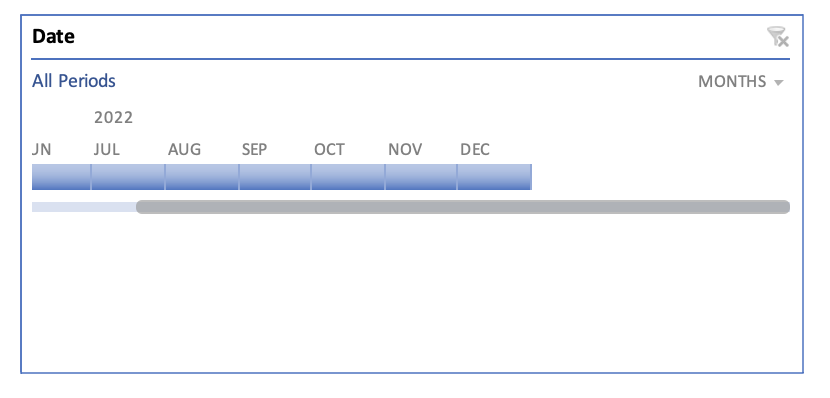
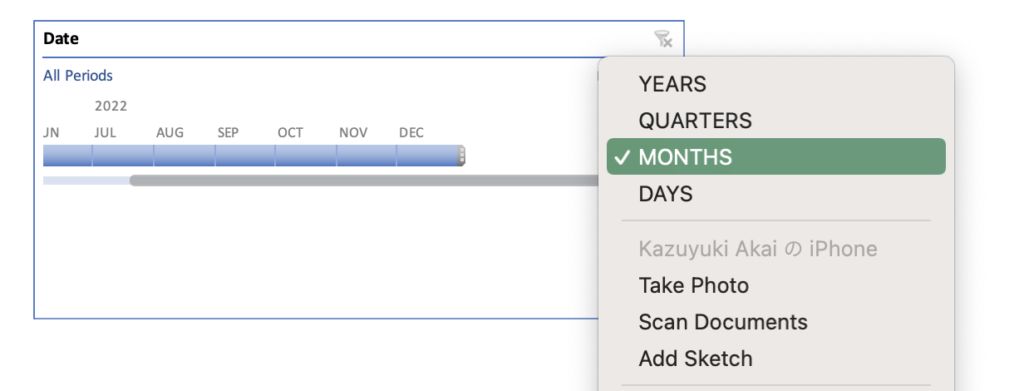
You can view only a specific month, or change the unit of measure, such as quarter or year, by clicking the arrow next to "month" in the upper right corner.
Insert about 17 rows and columns to display the timeline and slicer.
Place the slicer and timeline on top of the table.
Create Pivot Graphs
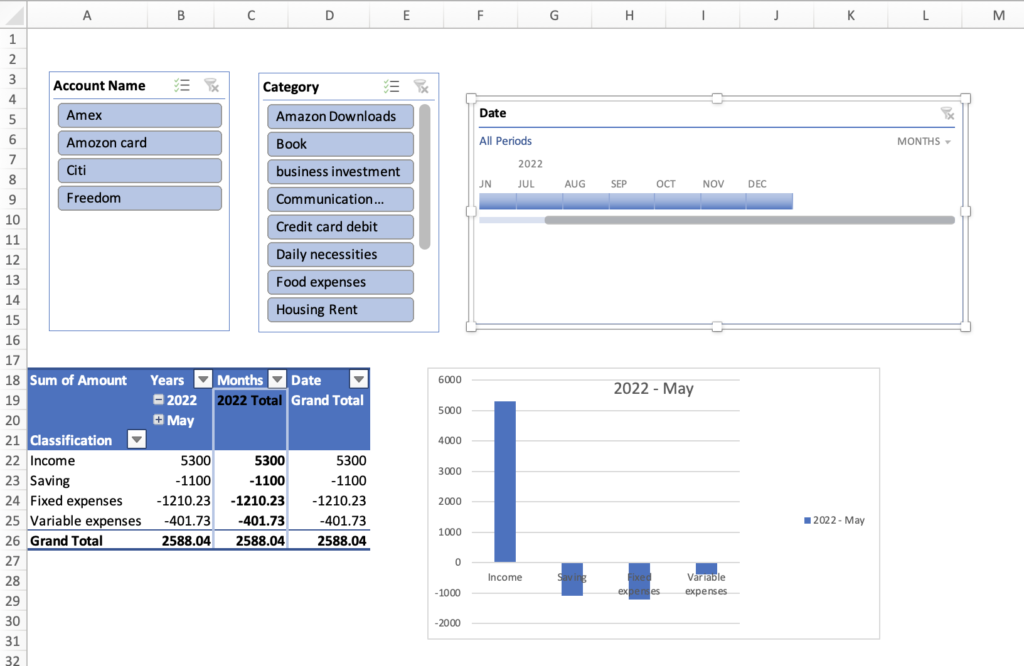
To create a pivot graph, copy and paste all the sheets from the household pivot table into a new sheet.
Uncheck the row's category items in the fields.
This is because it is difficult to see a lot of information when the category items are displayed in the graph.
Click on "Pivot Chart" in the Pivot Table Analysis.
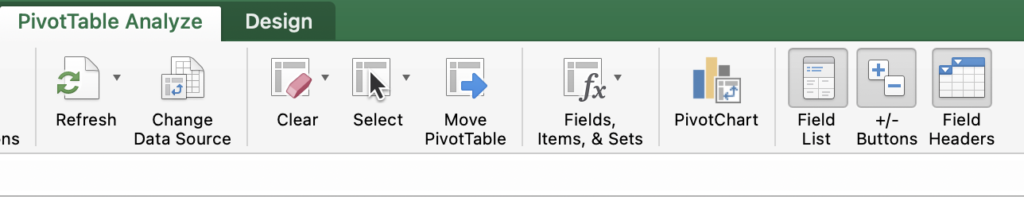
Chart will be added.
You can categorize by income, savings, fixed and variable expenses, or use timelines and slicers to pinpoint trends in certain items on a graph.
Add CSV data
Add the previous month's data to the household account when the month changes.
Download a CSV file from the asset management website.
Add data excluding headings.
Paste the created excel file, excluding headings into the last row of the table.
The data will be automatically converted to a table as you add it.
Edit the household data
- Add a classification column next to the last column and fill in income, savings, fixed expenses, and variable expenses.
- Delete rows that you do not want included in the calculation.
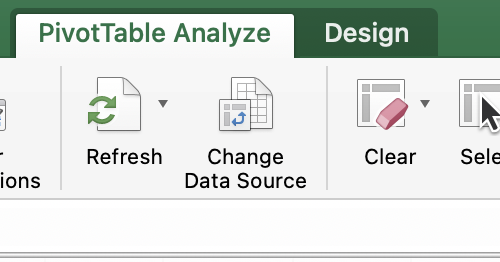
After editing the data, click the "Refresh" button in the pivot table analysis to update all the pivot tables.
How to use the sample templates
- Download the CSV or Excel file from the asset management application website
- Paste the data, into cell A1 of the data sheet.
- Delete rows that you do not want included in the calculation.
- Copy and paste column BC on the Classfication sheet into the last column of data.
- Enter numbers in Number column of the data and change them to Income, Savings, Fixed Expenses, and Variable Expenses.
- Convert data into tables.
- Create PivotTable.
- Create PivotChart.
- Add csv data when the month changes.
Free download
Click the Download button to download the Excel template.