One of the most important things for freelancers is sales management.
By properly grasping your sales and expenses, you can see
- the current state of your business
- your goals for next month and next year
- what you need to do to increase your sales
In reality, however,
I don't know how to start sales management.
It is troublesome to make a management chart, and I end up neglecting it.
I am sure that there are many of you out there who would like to do the same.
For those people, I have prepared a free template that specializes in sales management!
Recommended for
- Those who want to manage their sales
- Individuals who work as handmade artists, creators, consultants, lecturers, etc.
- Those who have started earning income from side jobs
- Those who have experienced sales mess before filing tax returns
- Those who are preparing to start their own business as freelancers
Features of the Sales Management Template
- Sales, expenses, and profits at a glance
With automatic tabulation, monthly and yearly income and expenses can be immediately visualized. - Includes a graph display
You can visually check sales trends and monthly fluctuations. - Input items are simple and easy to understand
Designed to be easy to keep track of, even if you are not good with numbers. - Also useful for tax return preparation.
If you record your daily sales and expenses, you can post them smoothly to your accounting software. - Free to download
Easy to start, zero cost. - Ideal for freelance and side hustle beginners.
No need for complicated knowledge, just follow the templates and enter your information.
Sales List

Sales Table
Expense List
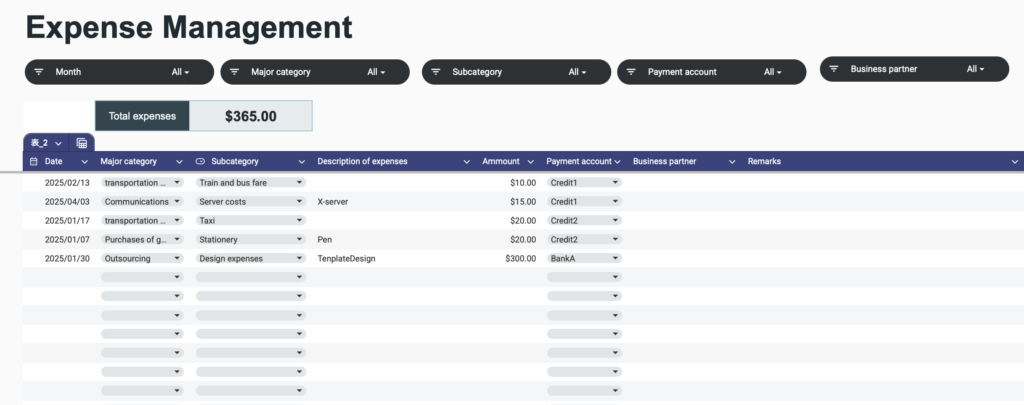
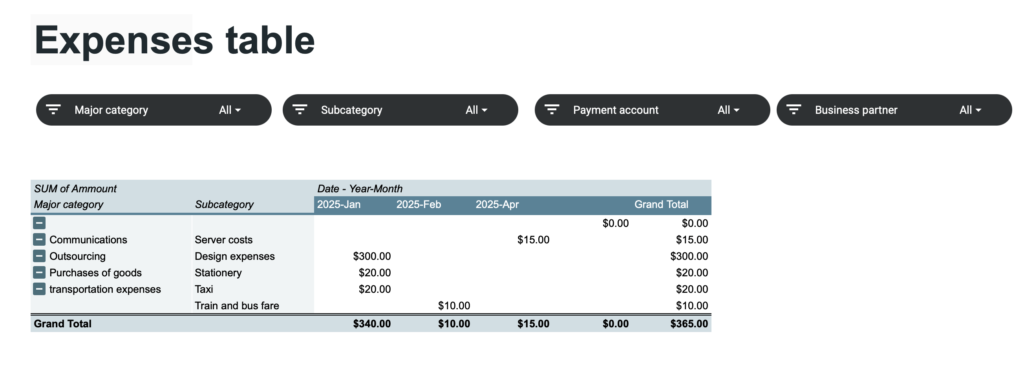
Expense Table
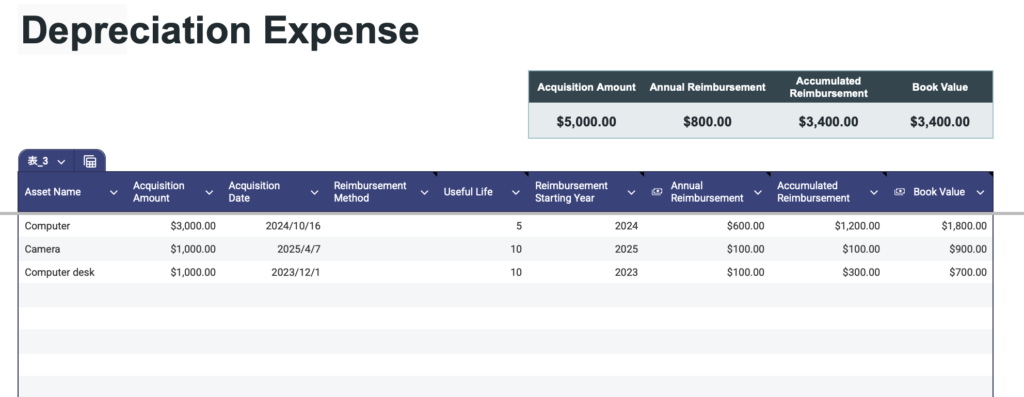
Depreciation Sheet
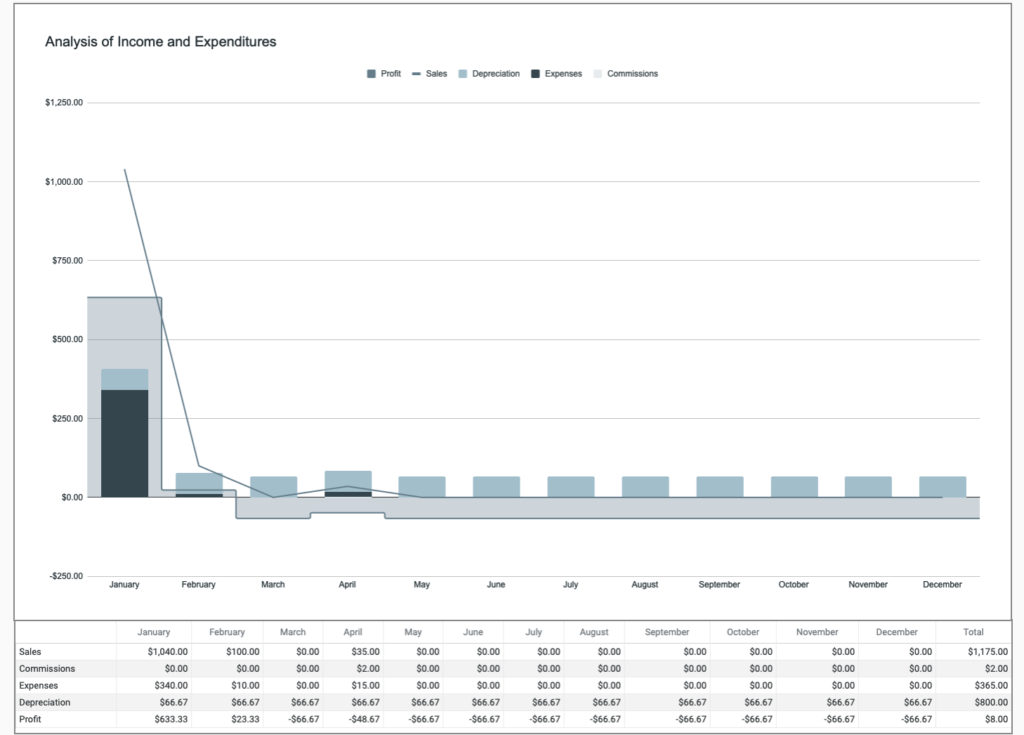
Annual Sheet
How to use the Sales Management Template
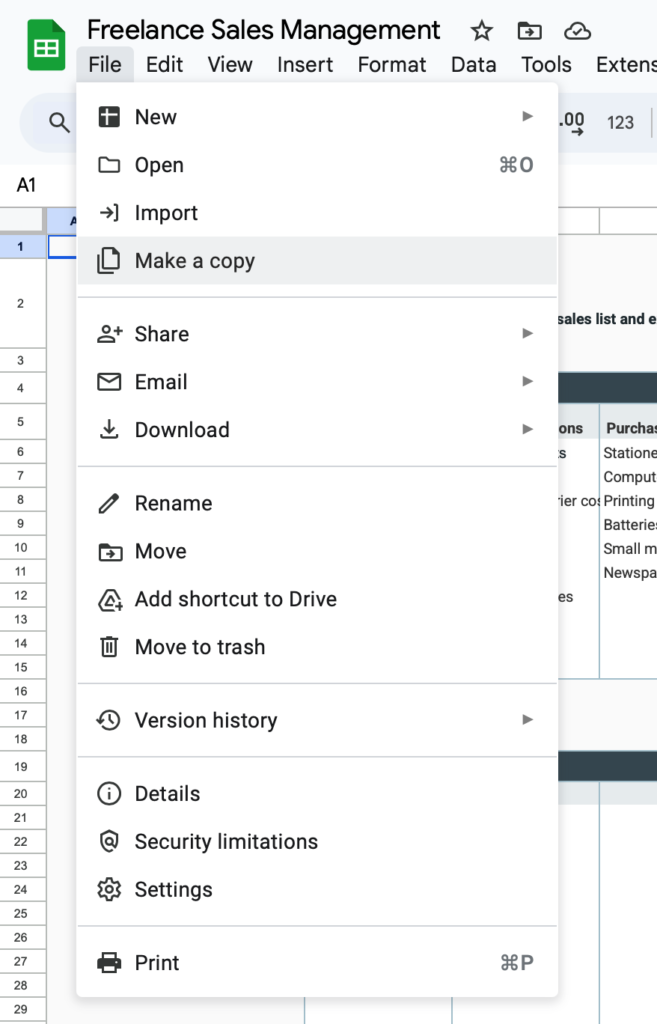
Download and save a copy
This file is for viewing only.
Please make a copy first before use.

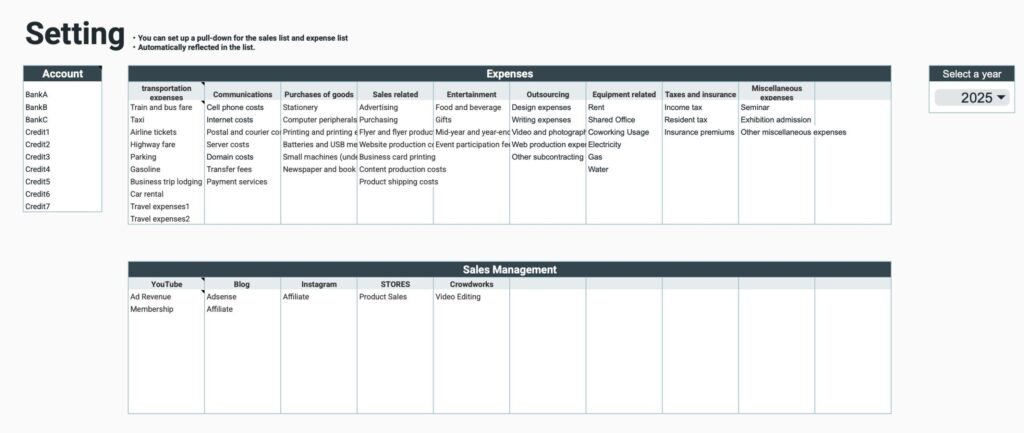
Setup sheet
Setup
- Account Name
Enter the account for withdrawals and deposits - Expense Categories
Categorize into large and small categories - Sales Management
Categorize into large and small categories - Select the year
Select the year from the tab
Sales Management should be arranged by platform, client, product, etc.
Use one file per year.
Please select the year to be used.
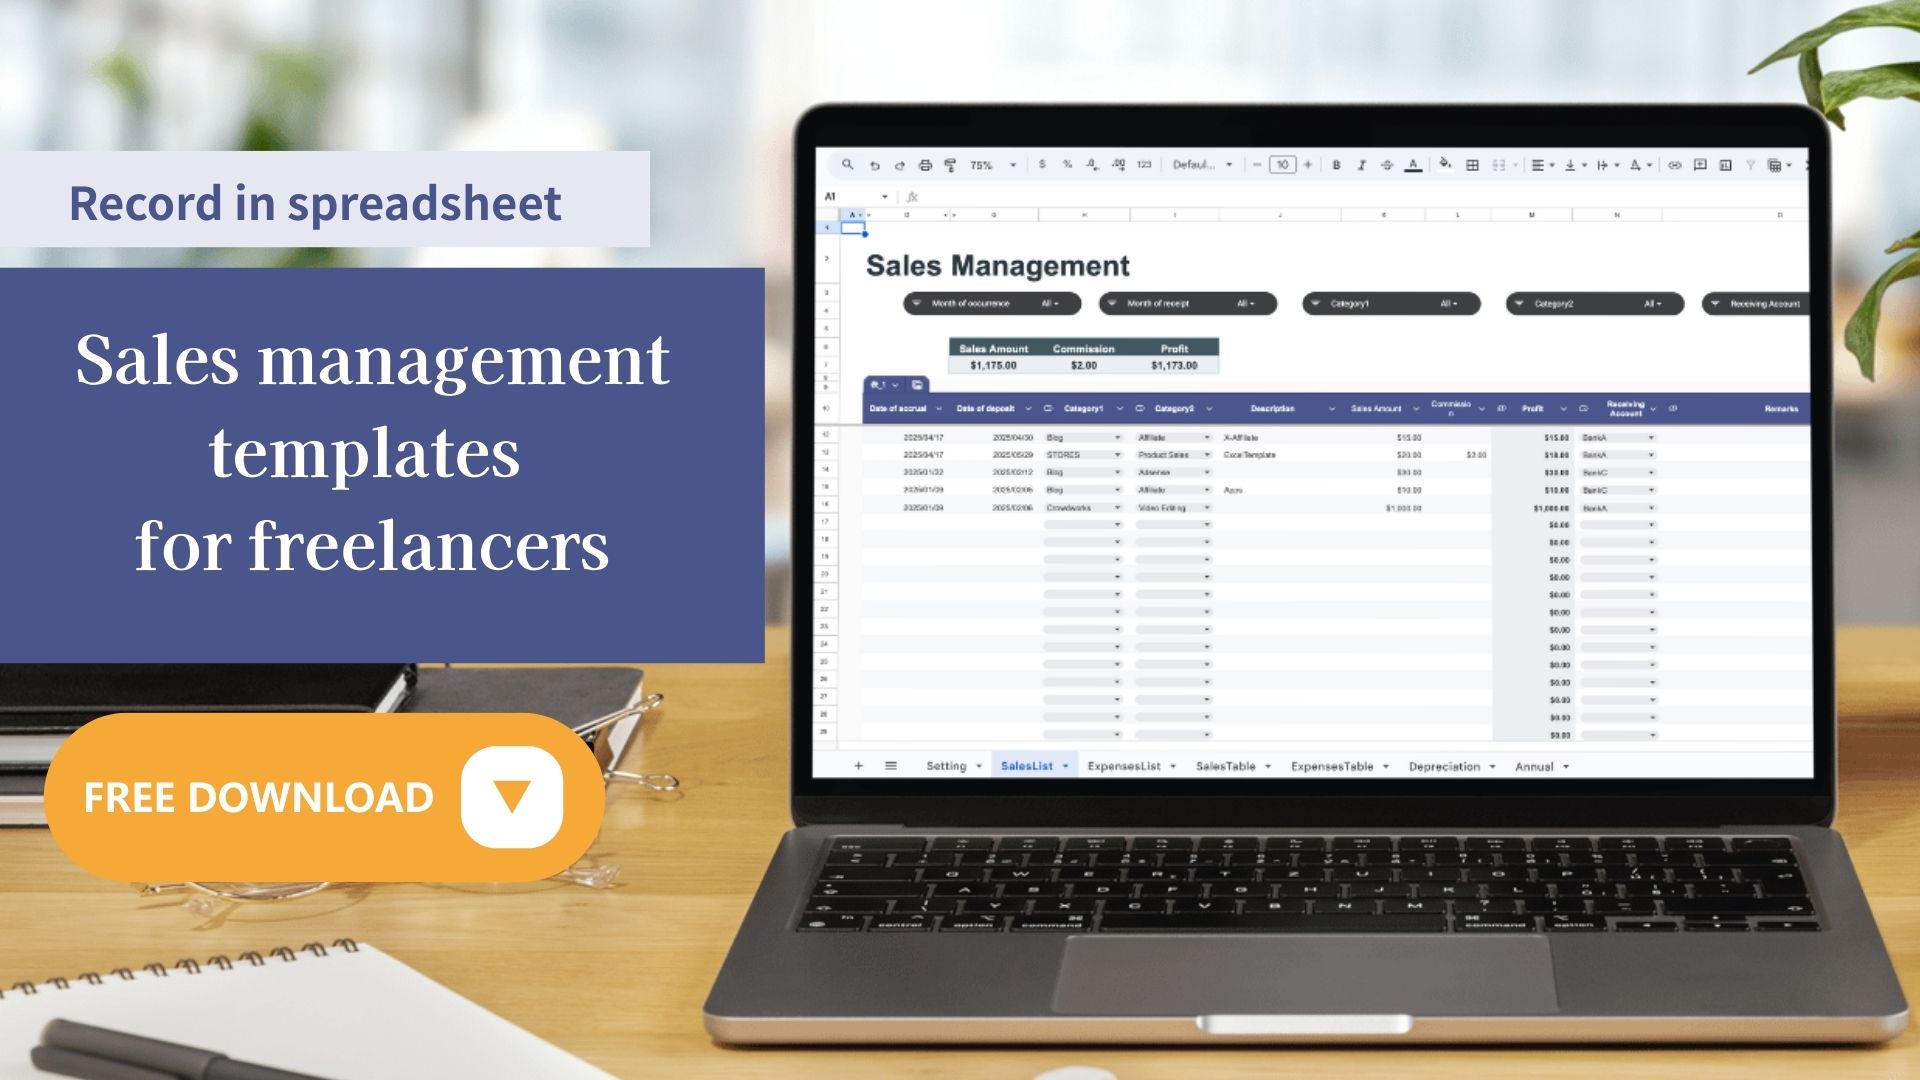
Sales list
In the Sales List, enter the sales amount by date.
Input items
- Date of Occurrence - select from calendar
- Date of Deposit - select from calendar
- Large Category-Select from tab
- Small Category-Select from tab
- Description
- Sales Amount
- Commission (blank if not generated)
- Receiving Account-Select from tab
- Notes
Profit is an automatically calculated item.
Profit = Sales amount - Commission

Slicer
You can use the slicer function to display specific items.
Slicer items
- Months of origination
- Months of deposit
- Large categories
- Small categories
- Receiving accounts

Show total number and total amount
Show totals at the top of the list
Display items
- Sales amount
- Commission
- Profit

When a particular item is displayed in the slicer, the total of the displayed items is shown.

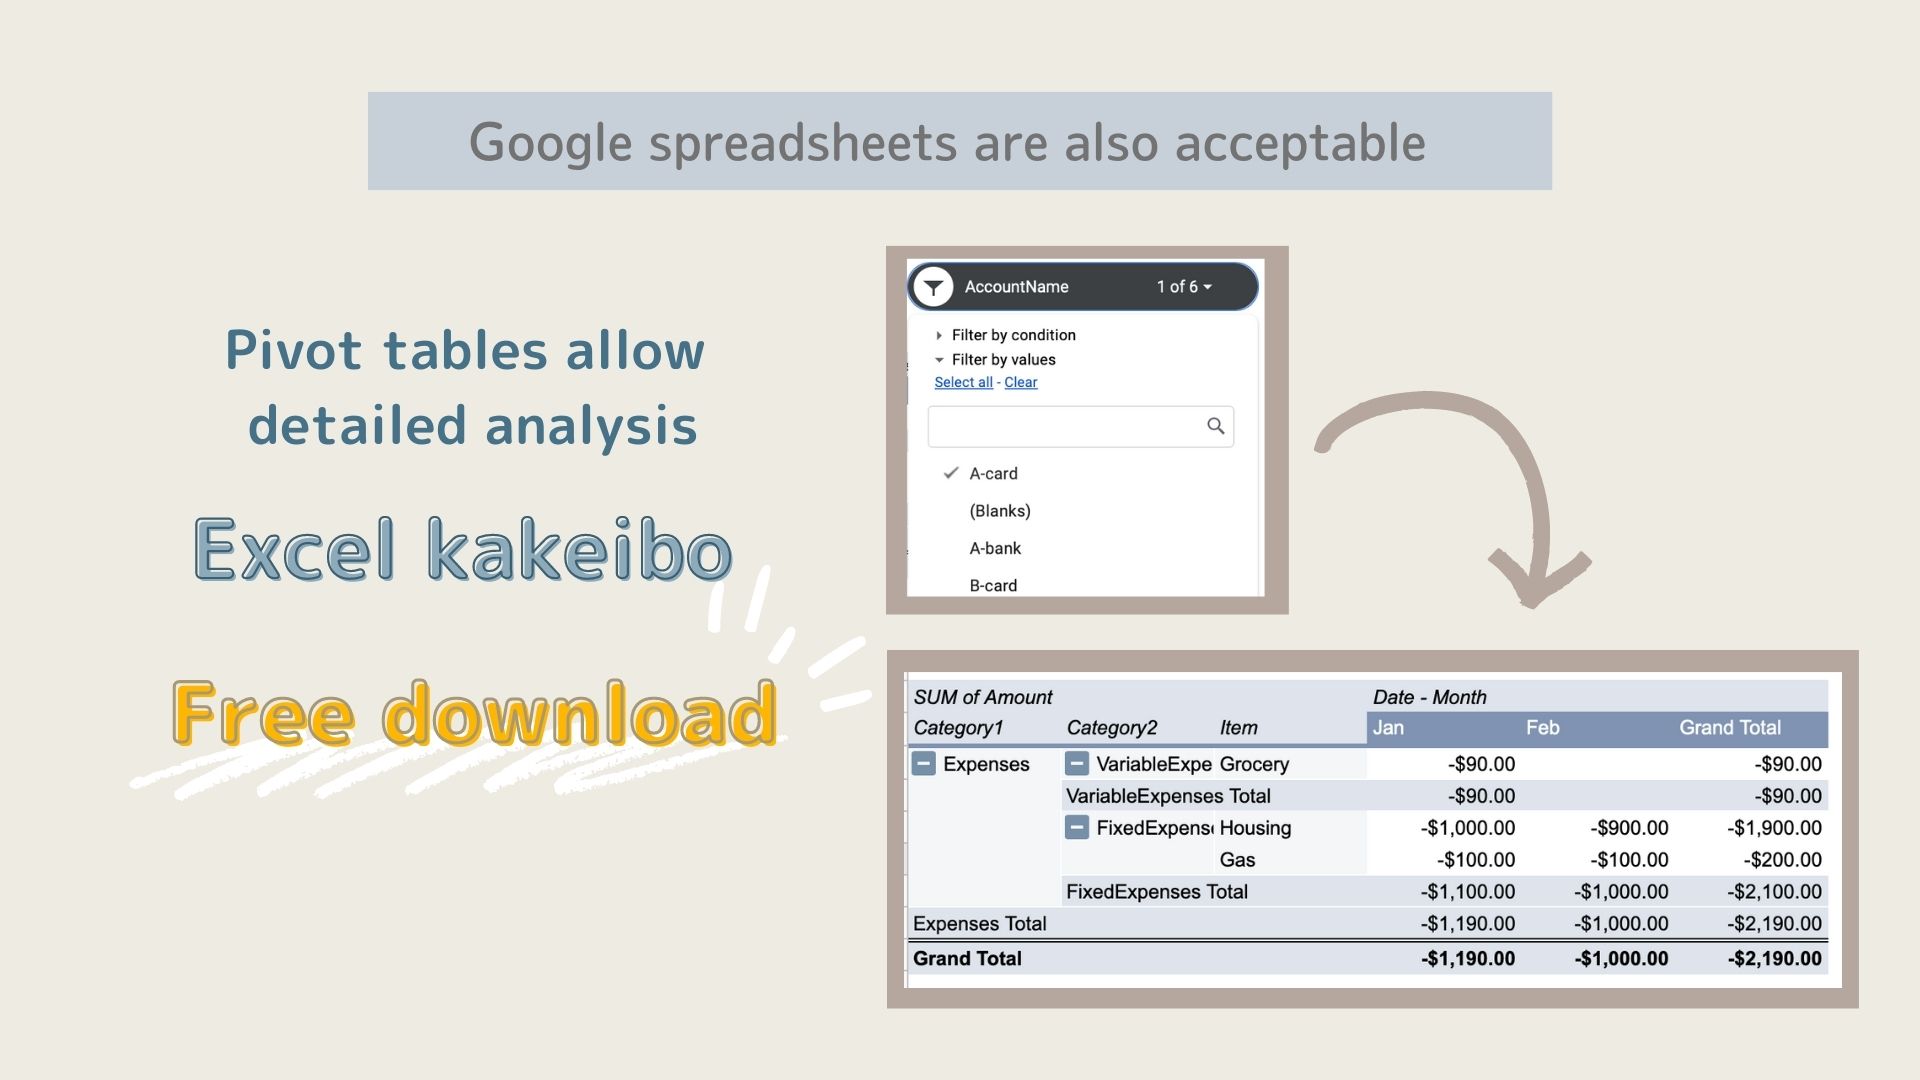
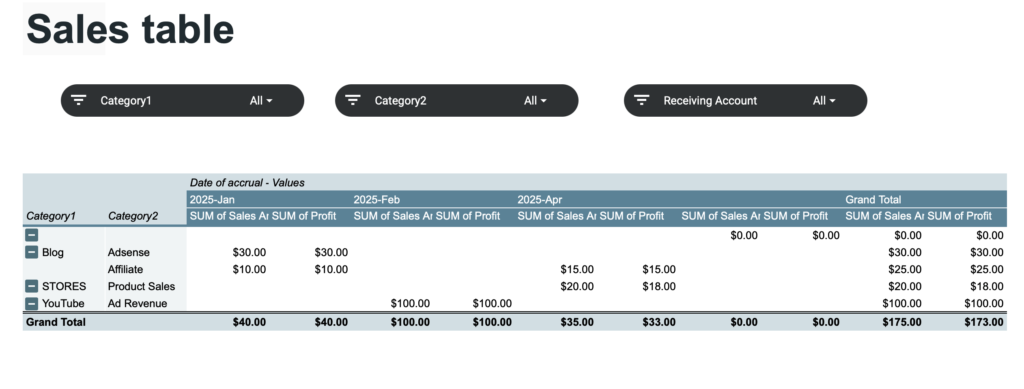
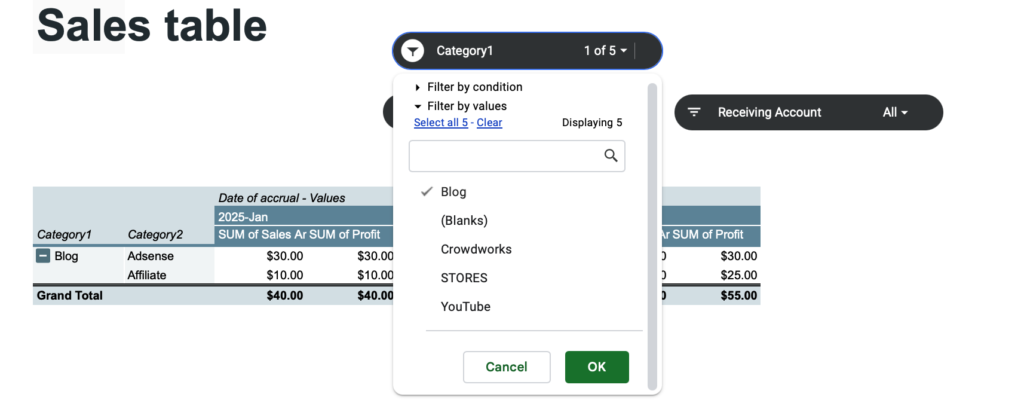
Sales table
Displays sales and profits by month and category based on sales list data.

The slicer function can also be used to display only specific items.
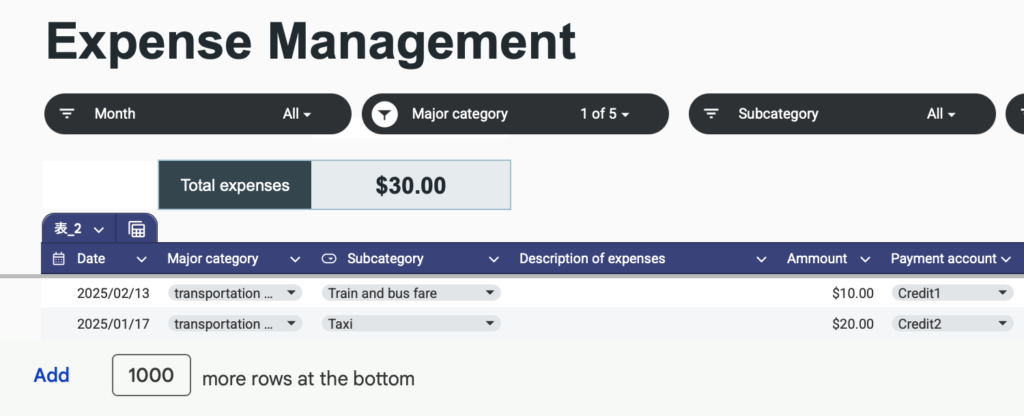
Expense list
In the expense list, enter expense amounts by date.
Input items
- Date - select from calendar
- Large category-Select from tab
- Small category-Select from tab
- Expense description
- Expense amount
- Payment account-Select from tab
- Business partner
- Notes

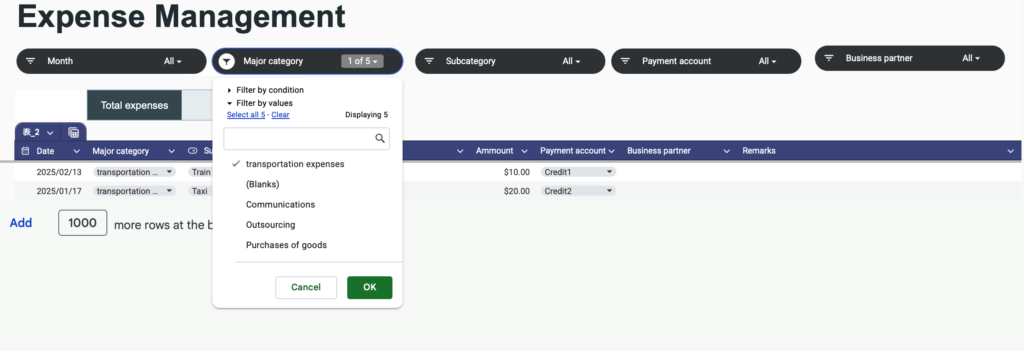
Slicer
You can use the slicer function to display specific items.
Slicer items
- Month
- Large category
- Small category
- Receiving account
Show total amount
Total expenses are displayed at the top of the list.

When a particular item is displayed in the slicer, the total of the displayed items is shown.
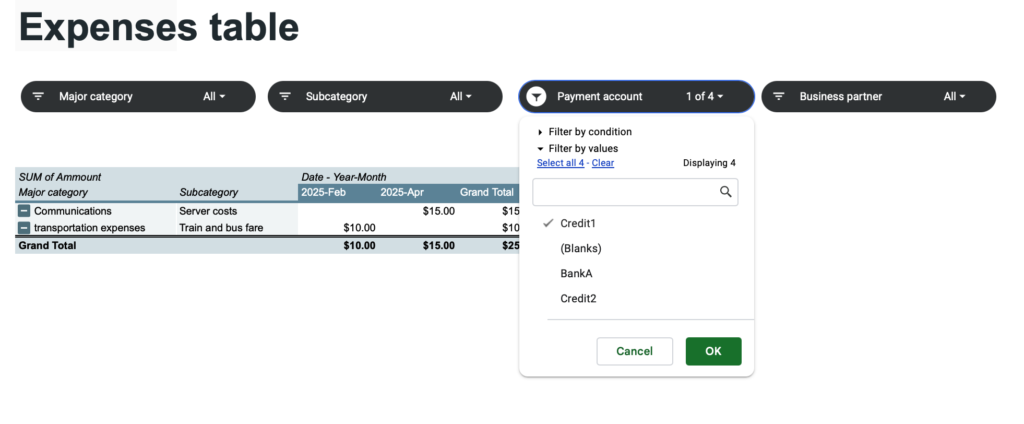
Expense table
Displays expense amounts by month and category based on expense list data.

The slicer function can also be used to display only specific items.
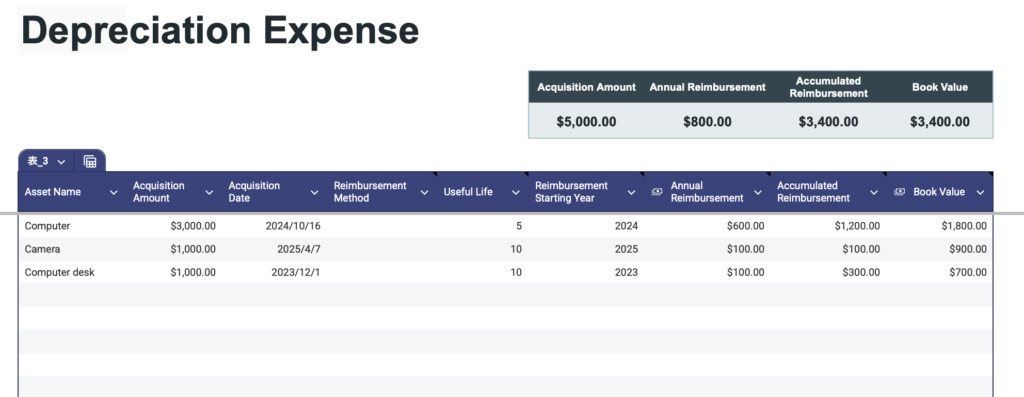
Depreciation sheet
Input items
- Depreciation is the process of allocating the cost of a tangible asset over its useful life.
- Asset name
- Acquisition amount
- Acquisition Date
- Depreciation Method: The method used to depreciate the asset (e.g., Straight-Line, Declining Balance).
- Useful Life: The number of years over which the asset will be depreciated.
- Depreciation Start Year :The fiscal year when depreciation begins.
- Annual Depreciation: Expense The amount of depreciation recorded each year.
- Accumulated Depreciation: The total depreciation recorded to date.
- Book Value :The remaining value of the asset after depreciation has been subtracted.
Annual sheet
Annual transition table
Data from the Sales List, Expense List, and Depreciation sheet are displayed by month.
Depreciation is calculated by dividing the total annual depreciation expense on the Depreciation sheet into 12 equal parts.
Profit = Sales - (Commission + Expenses + Depreciation)

Annual graph
Annual tables are displayed graphically.
Sales are shown as line graphs, profits as staircase surfaces, and all other items are shown as reserve graphs.

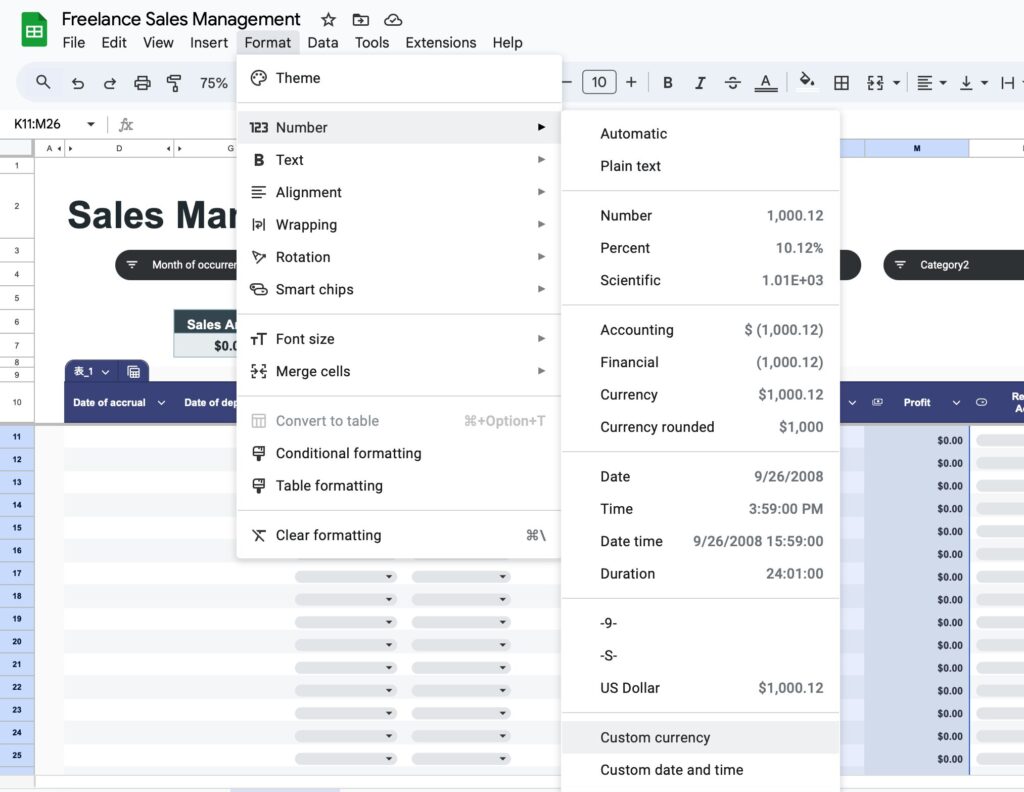
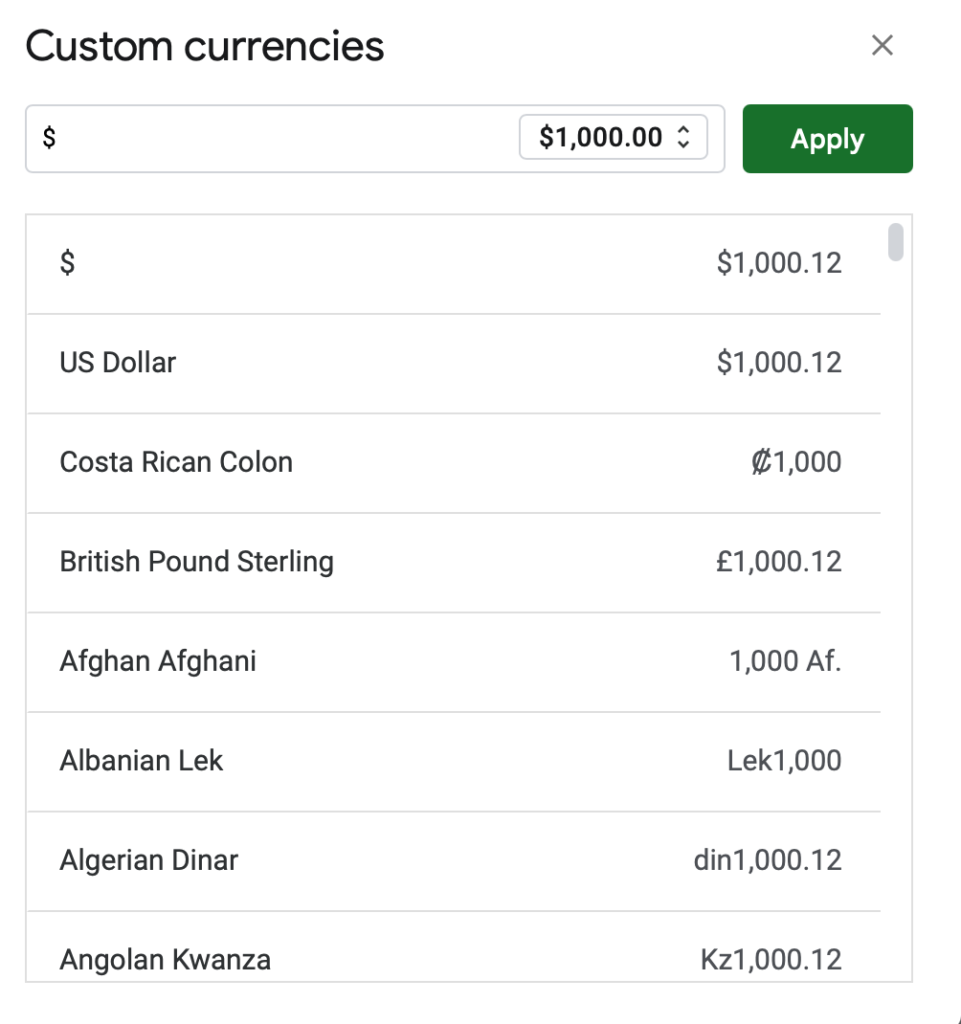
How to change currency units
The default currency unit is the dollar.
To change the currency unit, specify a range, and click Format,Number,Custom currency.
Free Download
Click the button below to download a free sales management template.
Download files are for viewing only.
Please “Make a copy and save” before use.

