Pivot tables make household budgeting more convenient!
Excel and spreadsheets are both popular spreadsheet tools, but which is easier to use in creating household accounts?
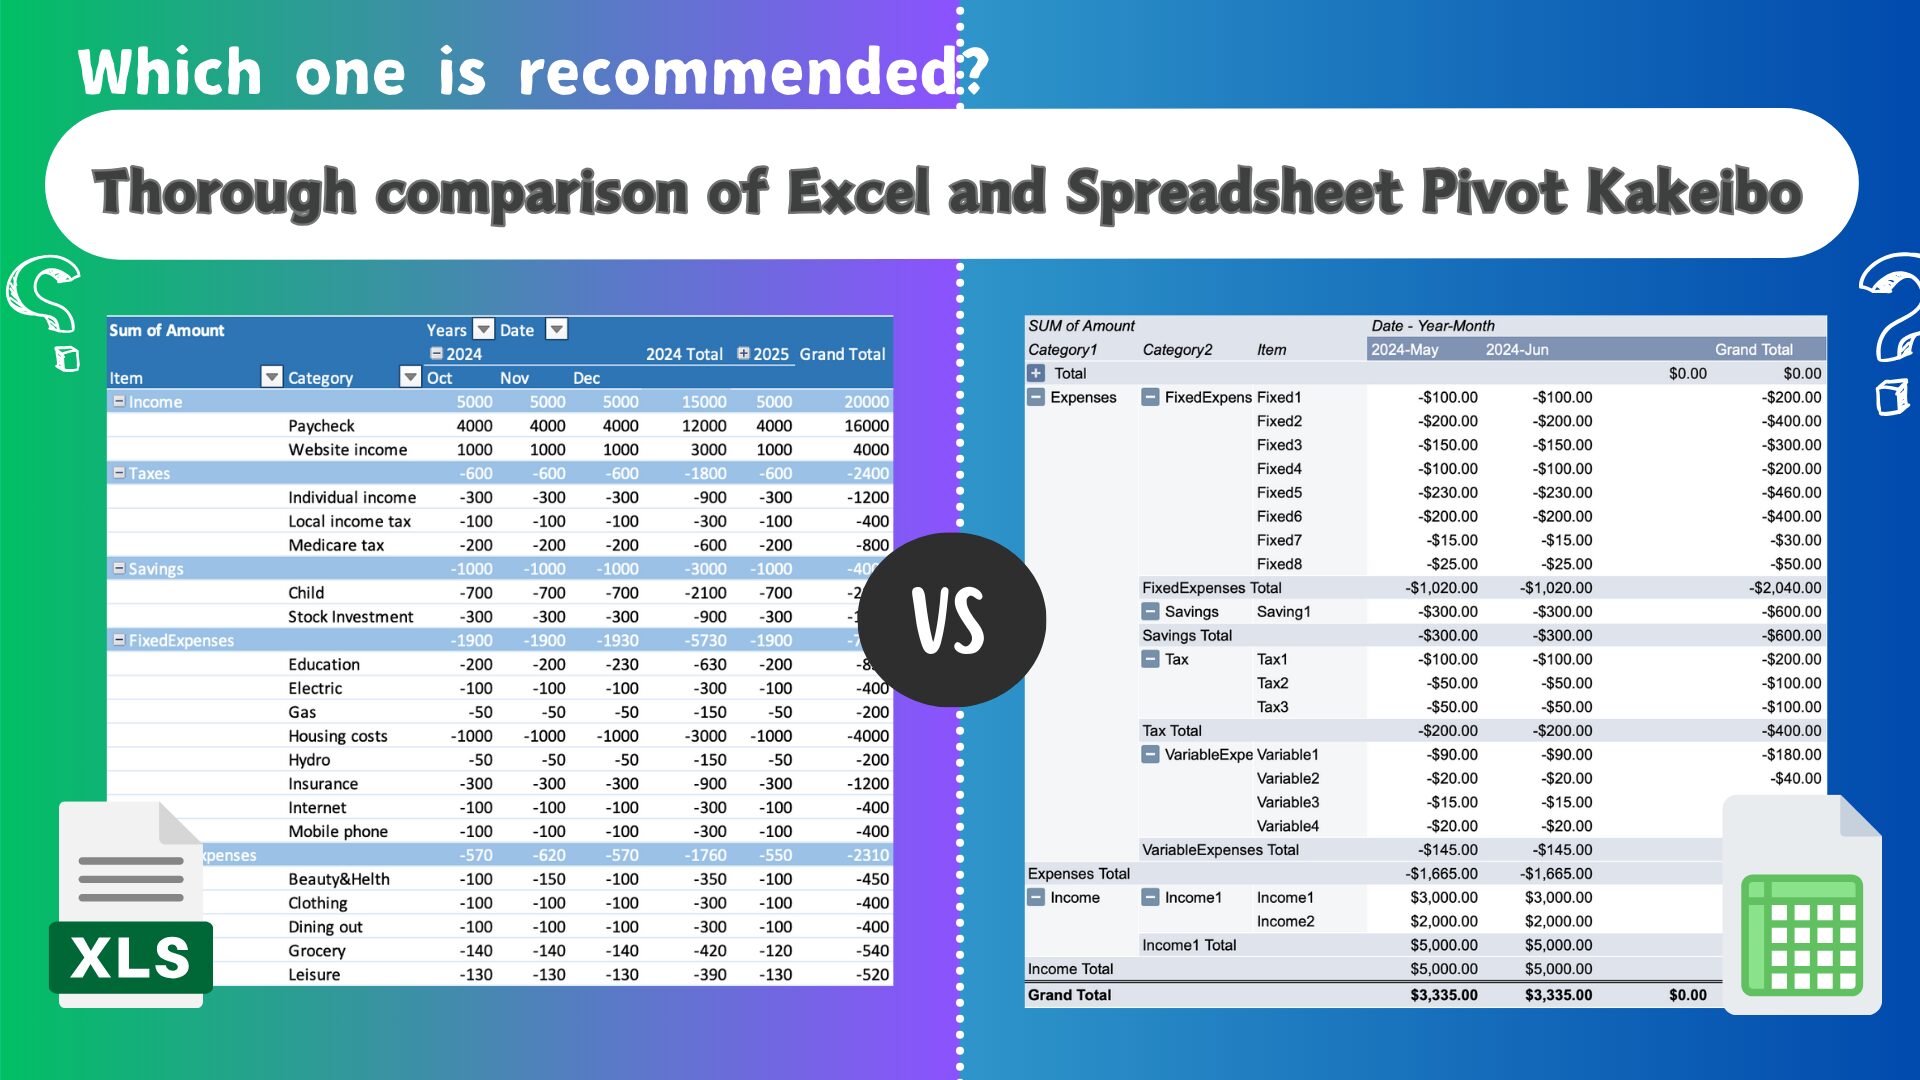
In this issue, I focus on the Pivot Table function, which many people find “convenient! I have made a thorough comparison of the two, focusing on the pivot table function, which many people find “convenient!
If you are looking for a more efficient way to manage your household finances, or if you are not satisfied with your current household account book, this is a must-see!
In this article, I will explain the pros and cons of Excel and spreadsheets in an easy-to-understand manner, while detailing what kind of household budget management style each is suited for.
Excel and Spreadsheet Characteristics

Software and access methods
Excel
- Software: Paid application included in Microsoft Office.
- Installation: Installed on a PC or Mac (online version also available).
- Access: Runs locally and does not require an Internet connection (except for the online version).
Spreadsheet
- Software: Part of Google Workspace, available for free (paid plans available).
- No installation required: Used with a web browser or smartphone app.
- Access: Cloud-based, requires Internet connection (offline mode available).
File storage and sharing
Excel
- Save format: Save files (.xlsx, etc.) on a local PC.
- Sharing: Share files via email or cloud service (e.g. OneDrive).
- Versioning: Often saved manually, not automatically (newer Office versions allow automatic saving).
Spreadsheets
- Save format: Automatically saved on Google Drive.
- Sharing: Easy to share by simply sending a link. Viewing and editing permissions can also be set.
- Version control: History is automatically saved, making it easy to revert to a previous version.
Functional differences
Excel
- Advanced features: A wide variety of advanced data analysis and automation features, such as macros (VBA) and pivot tables.
- Customizability: Easy to customize using programming skills.
- Data capacity: Strong for processing large volumes of data (more than 1 million rows are possible).
Spreadsheets
- Collaboration: Good at simultaneous editing by multiple people (reflected in real time).
- Add-ons: Extensions can be added from Google Workspace Marketplace.
- Data capacity: The maximum number of cells is limited compared to Excel (currently about 5 million cells).
prices
Excel
Paid (requires Microsoft 365 subscription or bulk purchase).
Spreadsheet
Basic functionality available for free. Additional features for businesses are paid plans (Google Workspace).
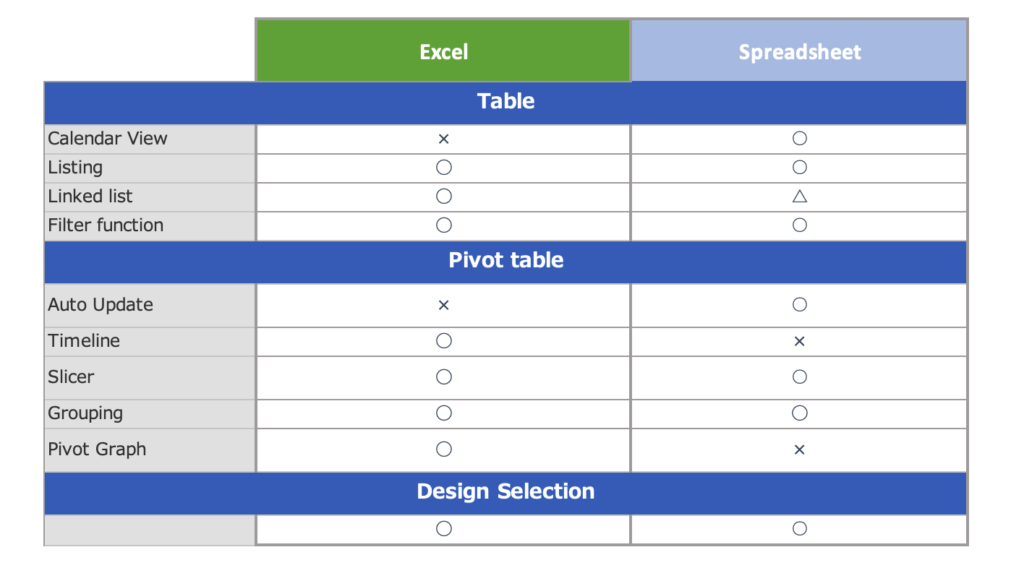
Comparison of Pivot Table Kakeibo
Input Sheets
Table Functions
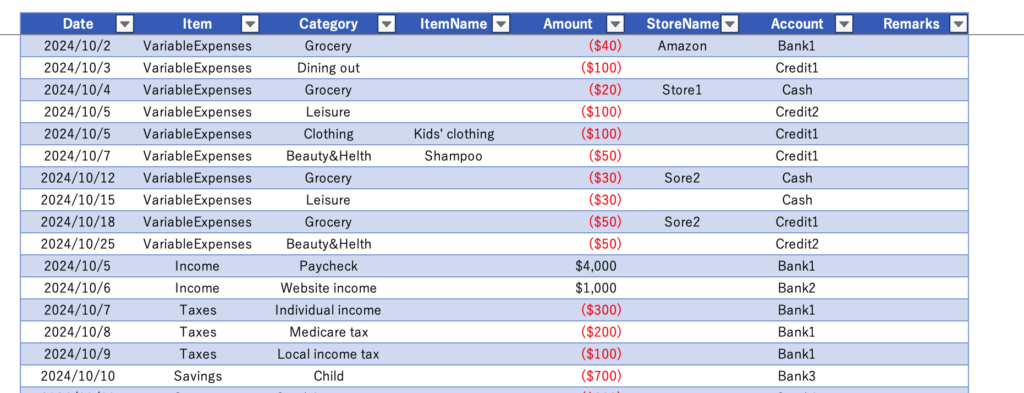
Using the table function, data created can be automatically converted into tables.
Features of the table function
- When data is added, a frame is automatically added.
- Using a table, formulas are automatically reflected in the same column.
- The design of the table can be selected.
Excel
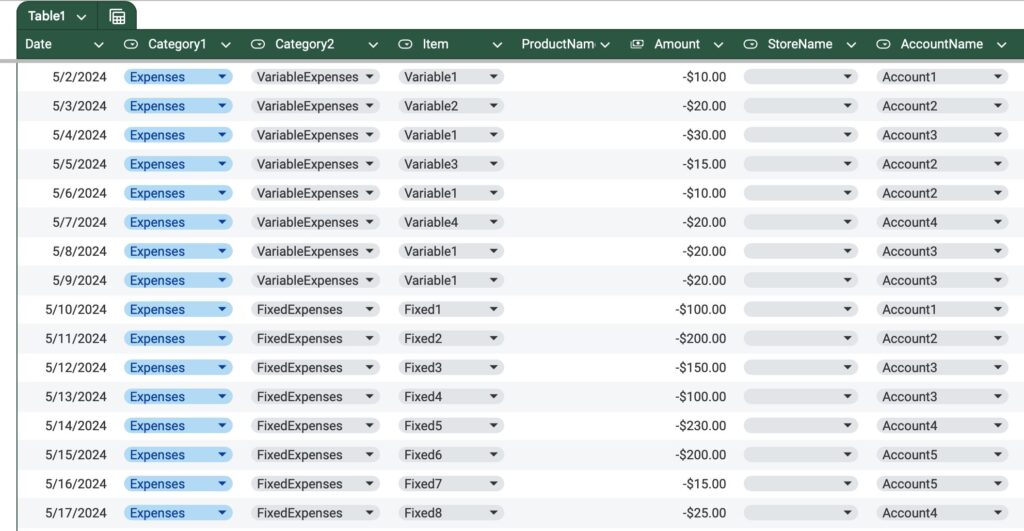
Spreadsheet
Table functionality was added in May 2024 and is now available in spreadsheets.
Calendar view
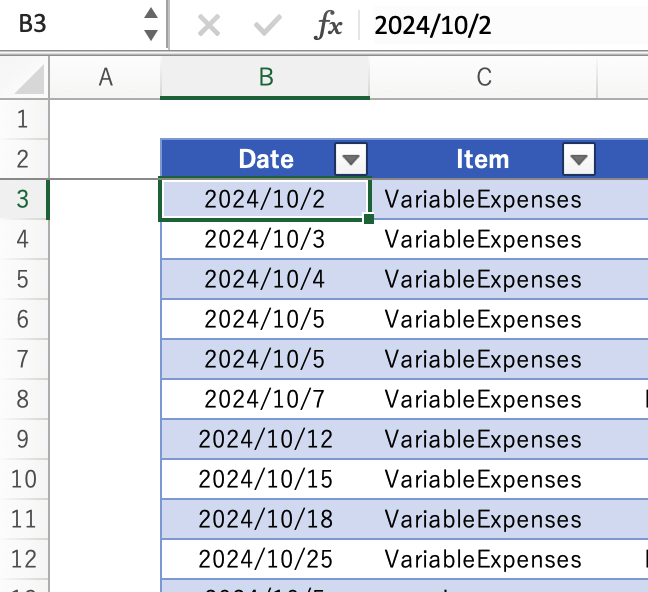
Excel
In Excel, the calendar is not displayed, so the date must be entered manually.
Entering “10/5” will display “2024/10/5.”
If you use a macro, you can display the calendar in Excel.
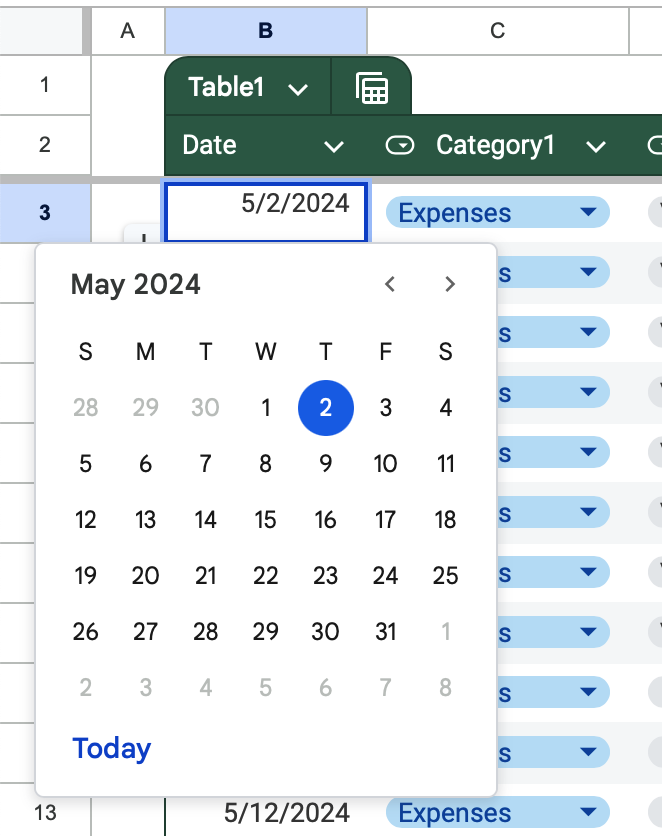
Spreadsheet
Double-click on a date cell to display the calendar.
Today's date is marked for easy date selection.
Listing Function
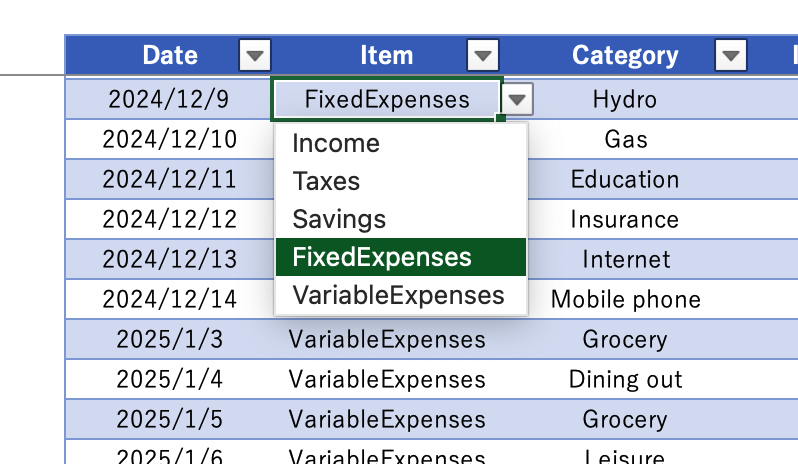
Excel
The use of lists eliminates the need for manual input and prevents input errors.
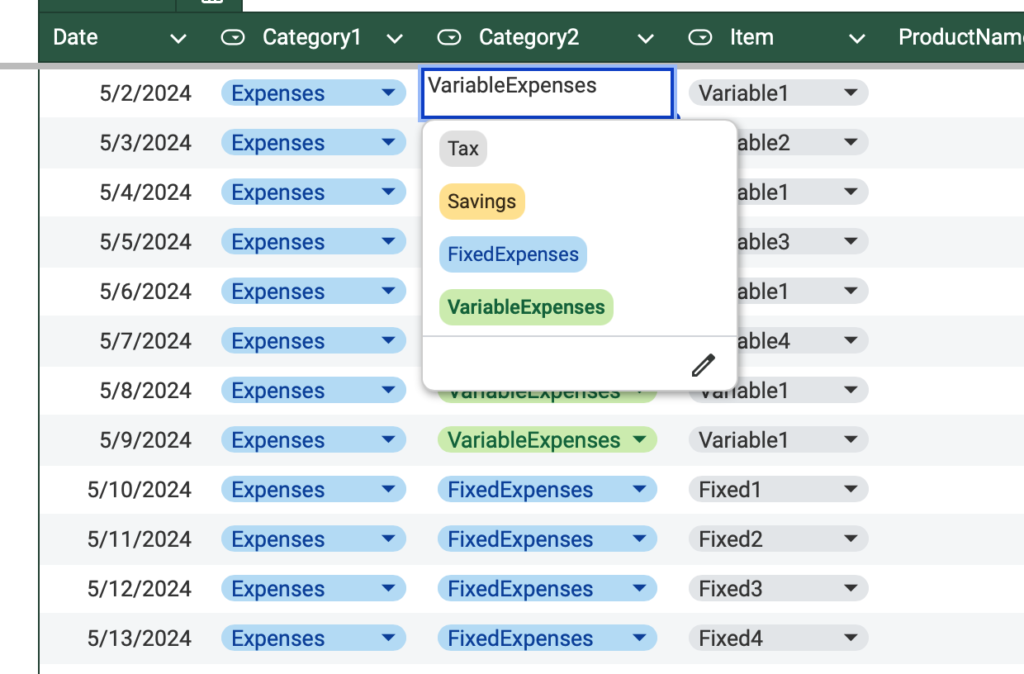
Spreadsheet
If the contents of the list are fixed, you can select a color.
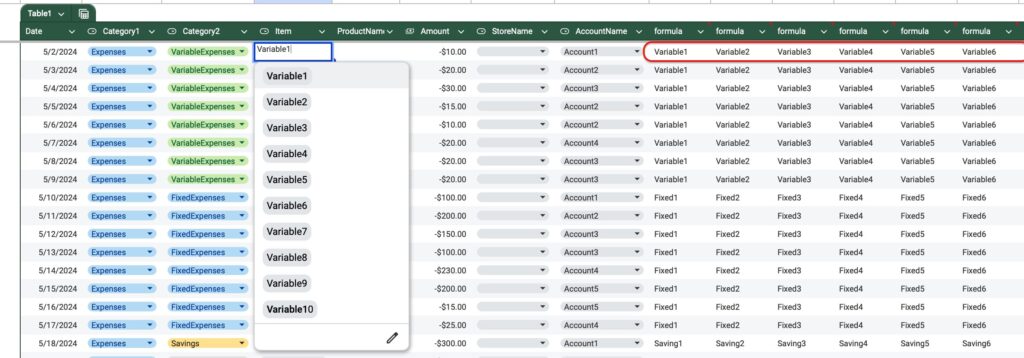
Linked Lists
The name of the expense item linked to the item name can be displayed.
Excel
The INDIRECT function can be used to easily display linked lists.

Spreadsheet
We are unable to list using the INDIRECT function.
The right column displays the name of the expense item linked to the item, and the display items are listed.
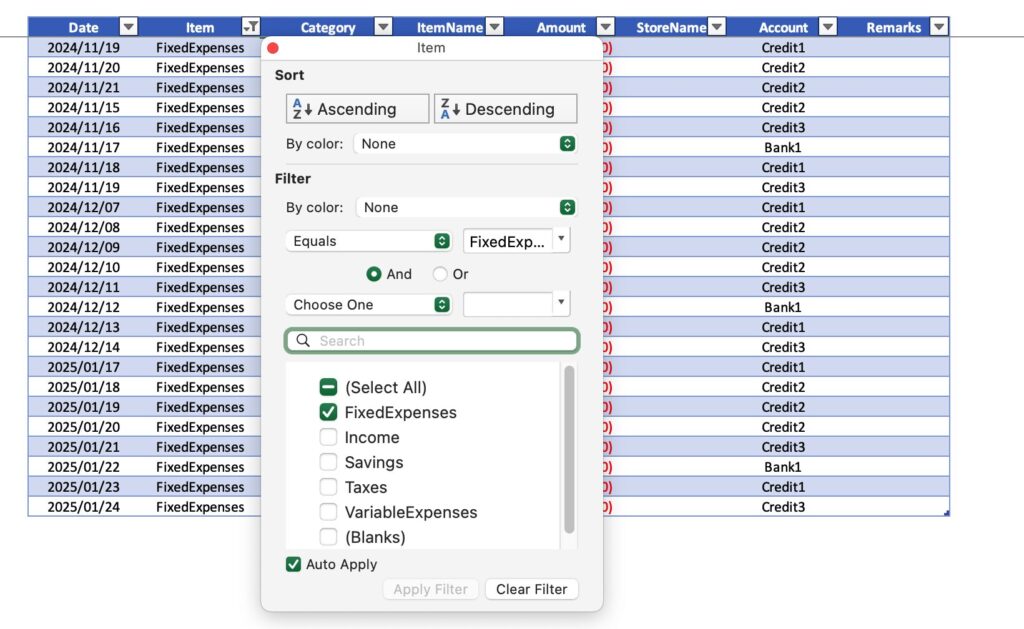
Filter Functions
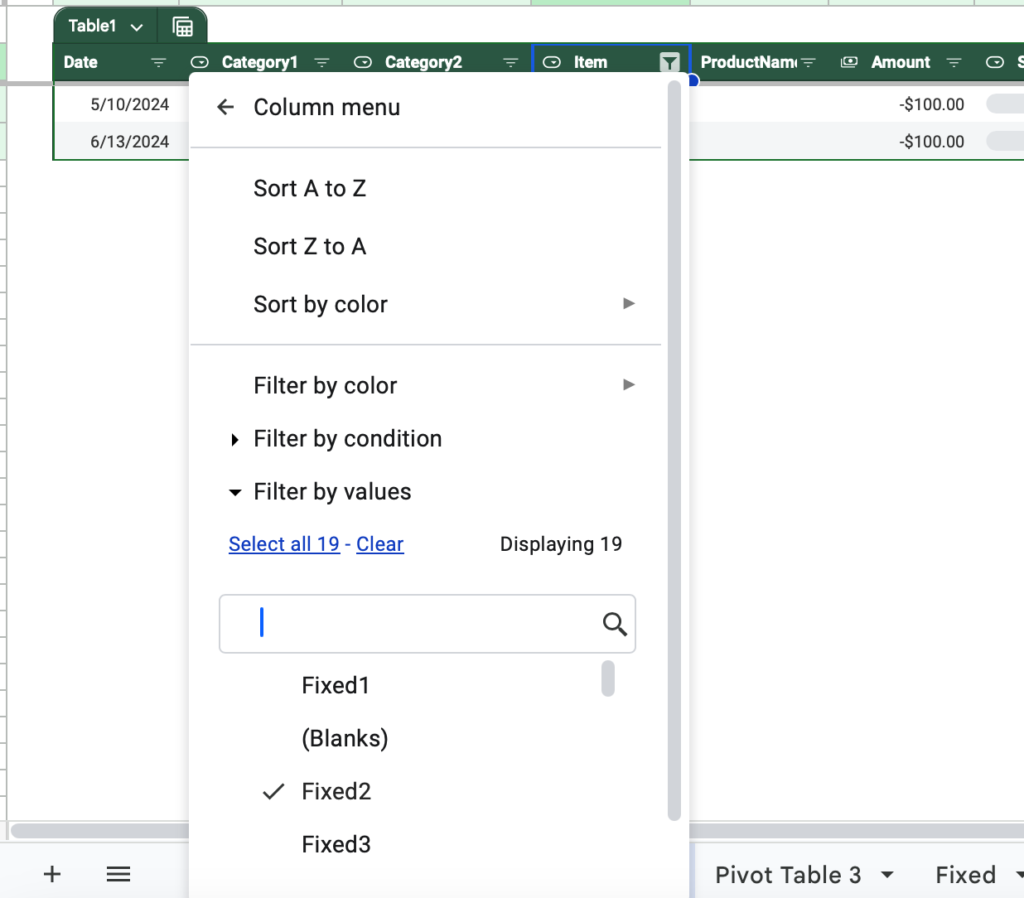
A filter function allows specific items to be displayed or sorted by date.
Excel
Spreadsheet
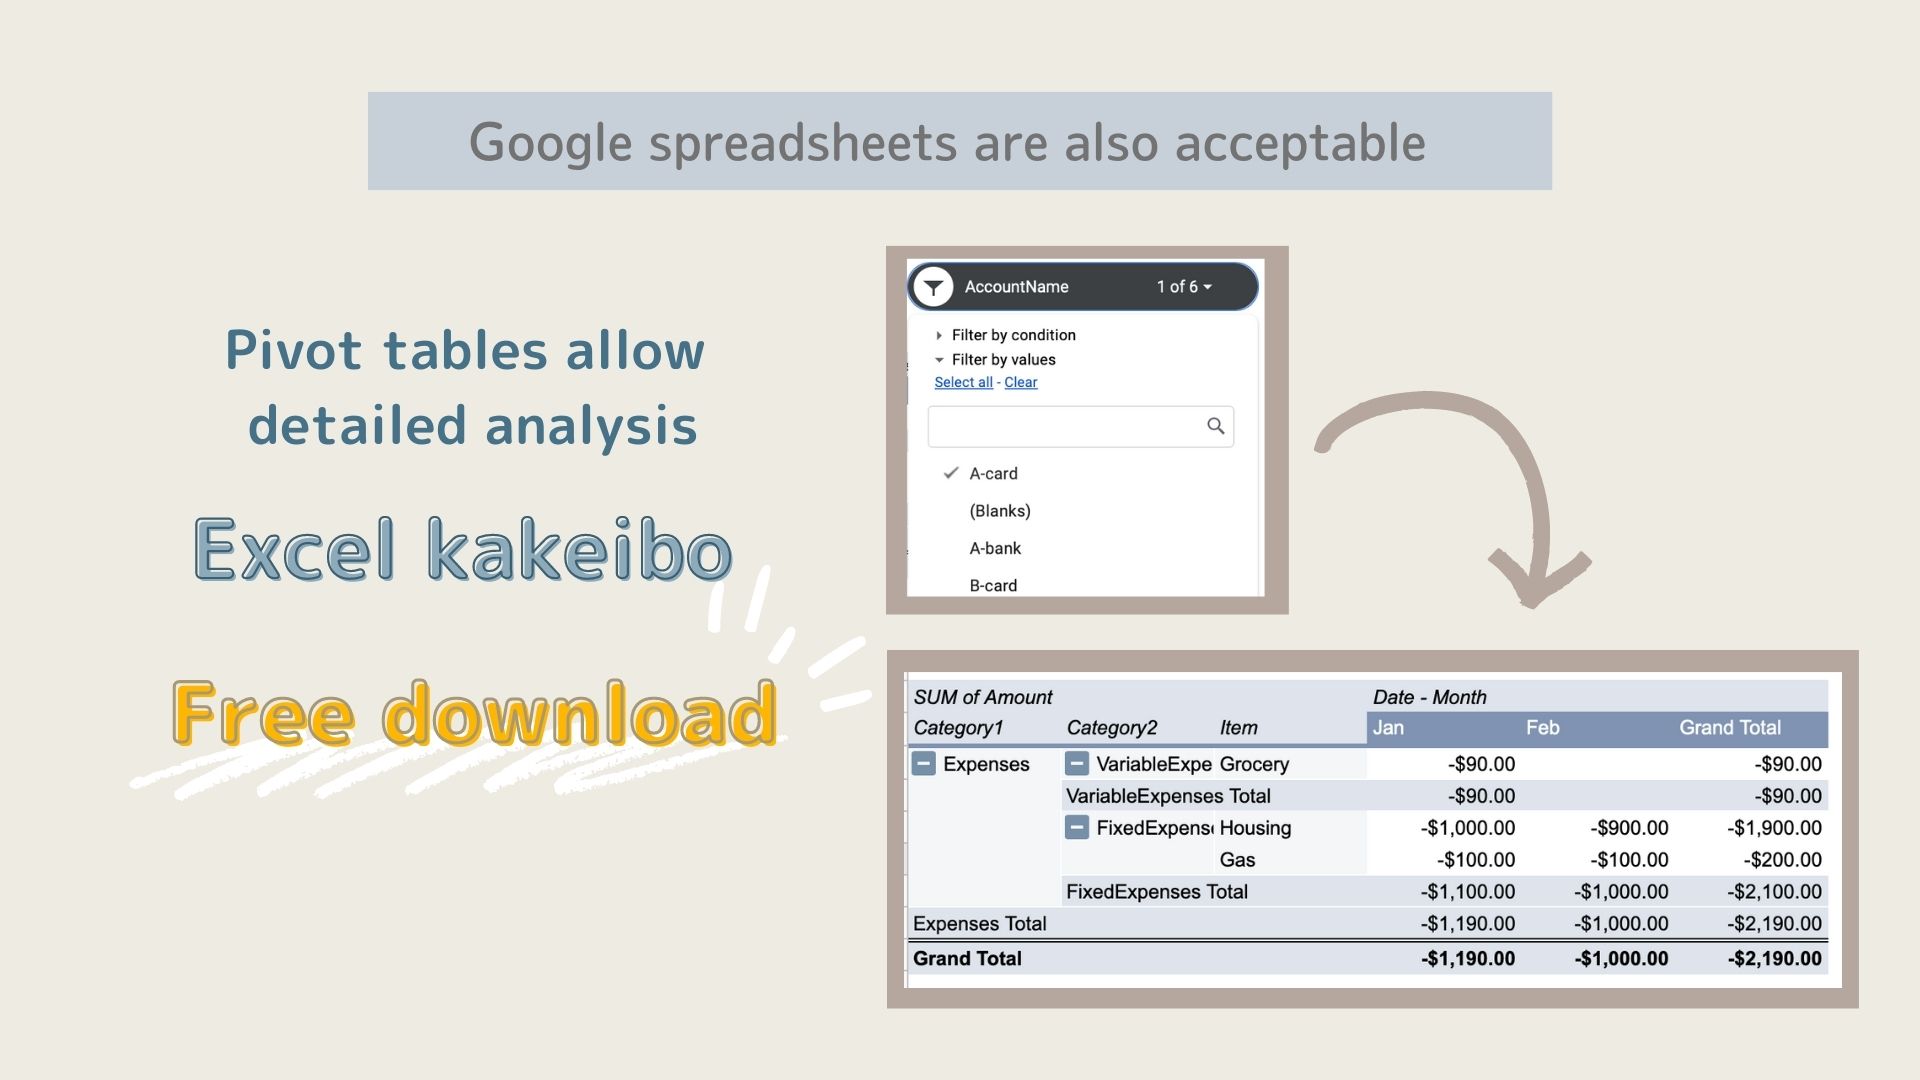
Pivot table
This function automatically updates the pivot table each time you enter information on the input sheet.
Auto Update
Excel
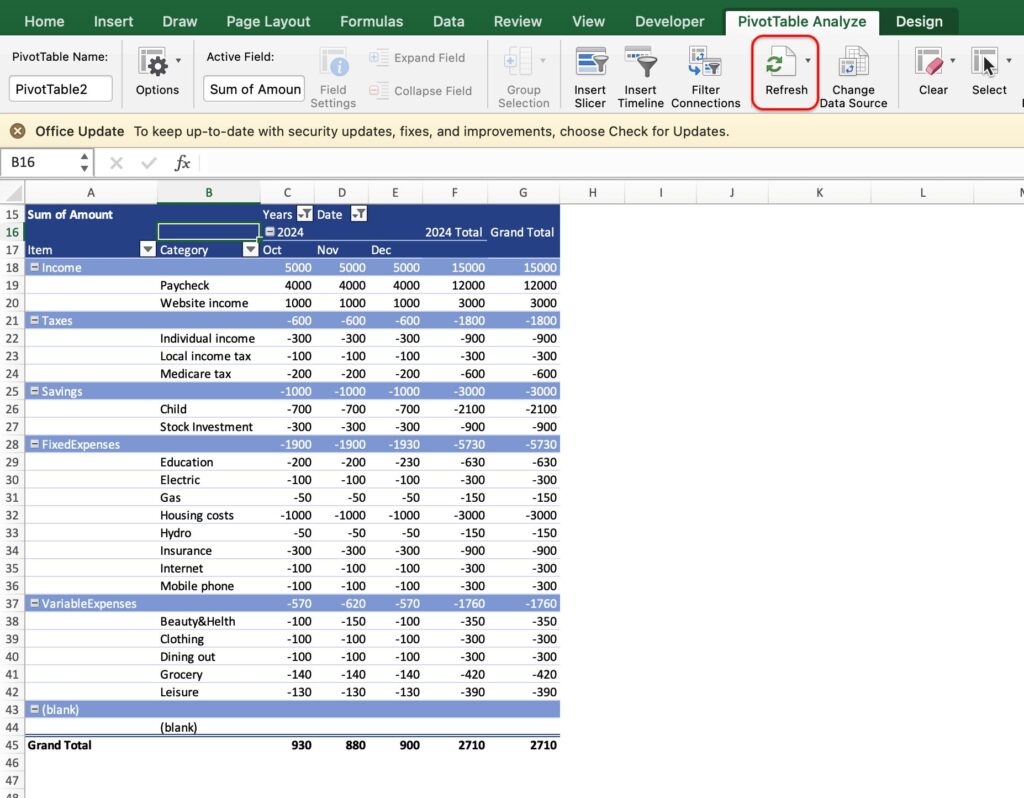
In Excel, you must click the “Refresh” button each time you enter an input sheet.
Spreadsheet
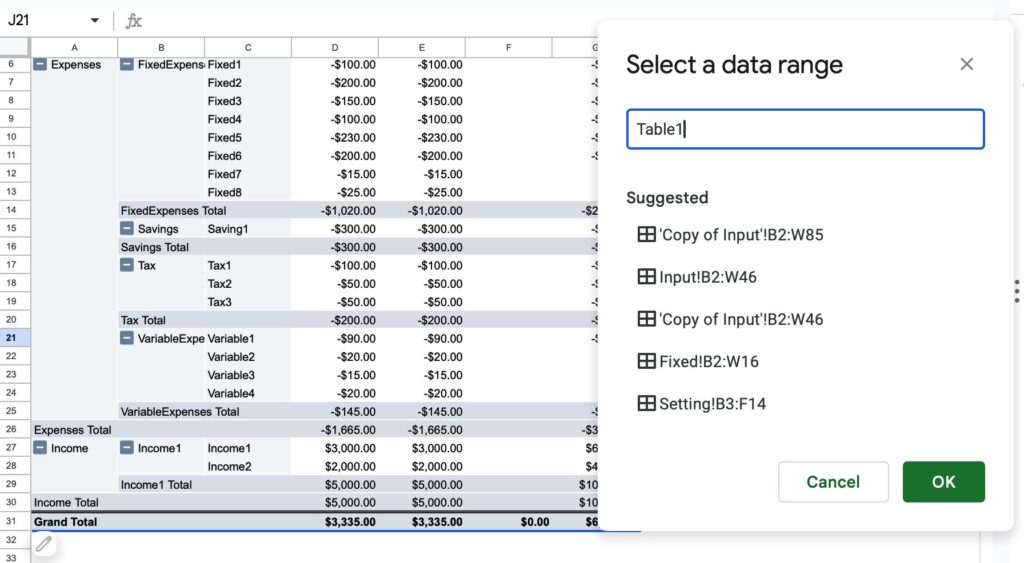
In the spreadsheet, pivot tables are automatically updated.
Only if the table in the input sheet is converted to a “table” will it be automatically updated.

Timeline
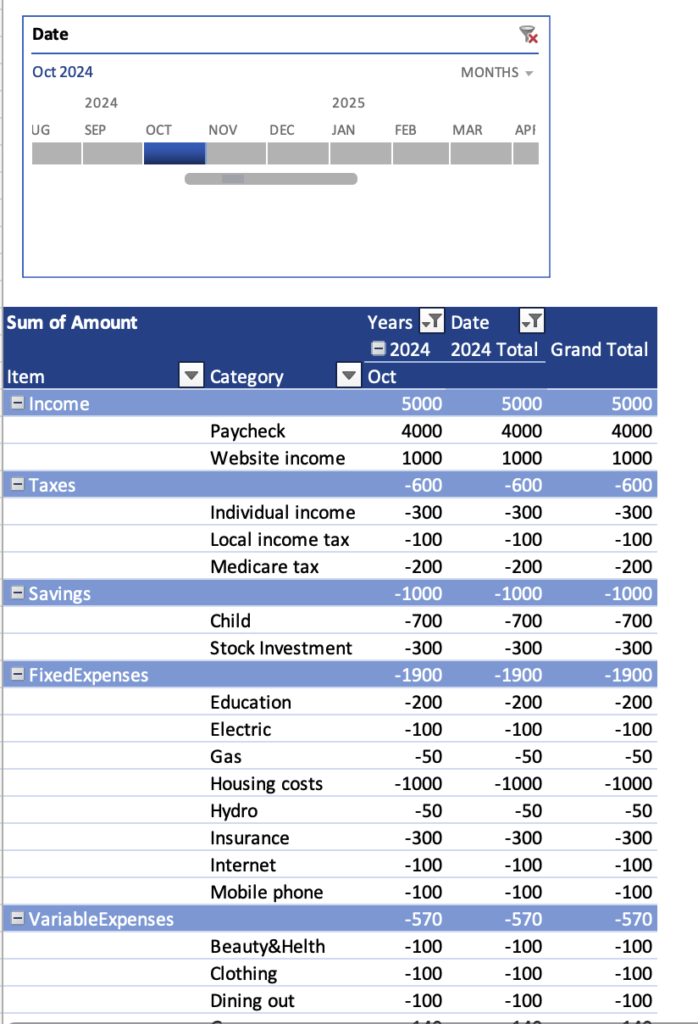
The timeline can be used to display by month, quarter, or year.
Excel
This function is useful when you want to display only a specific month.
Spreadsheet
There is no timeline function.
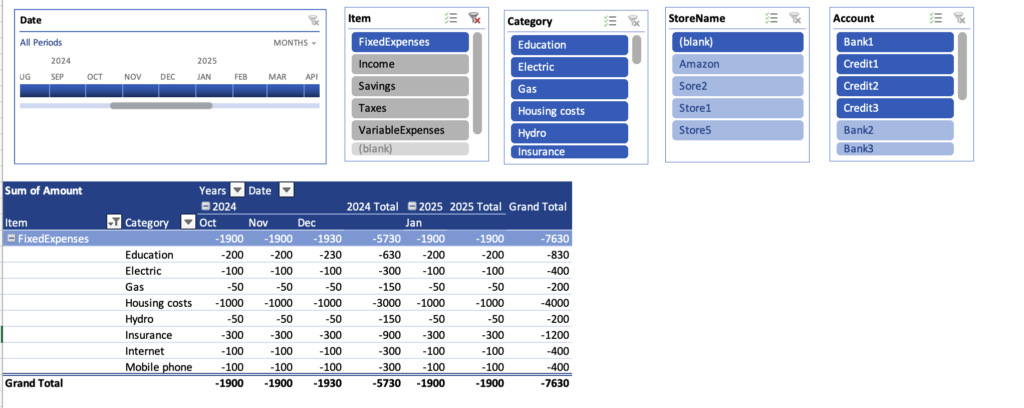
Slicer
This function allows you to display specific items, accounts, expense item names, etc.
Excel
Spreadsheet
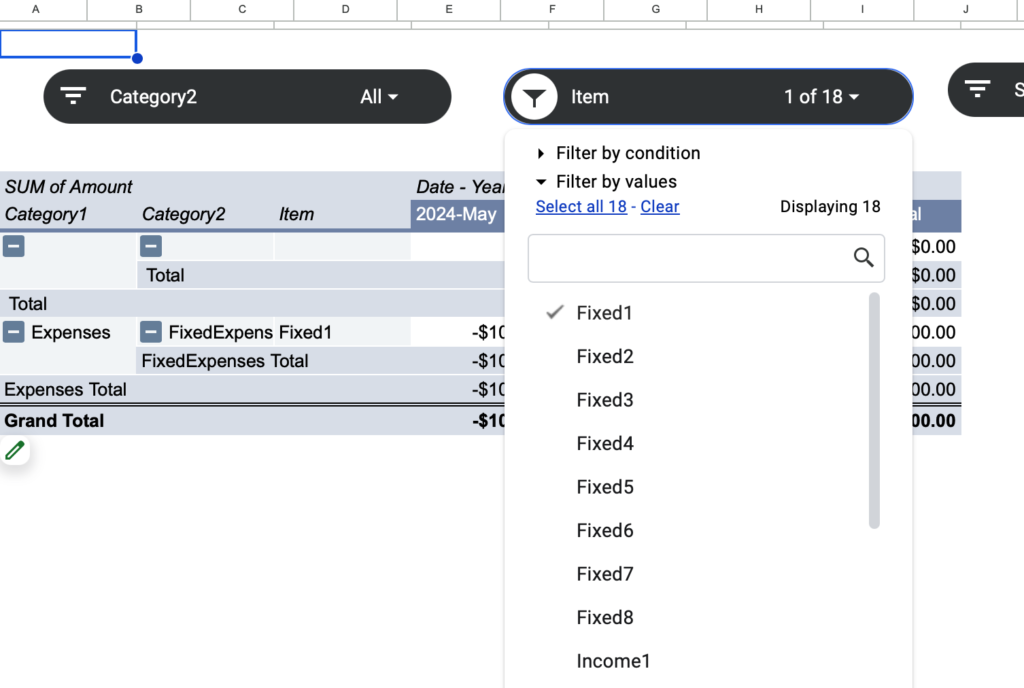
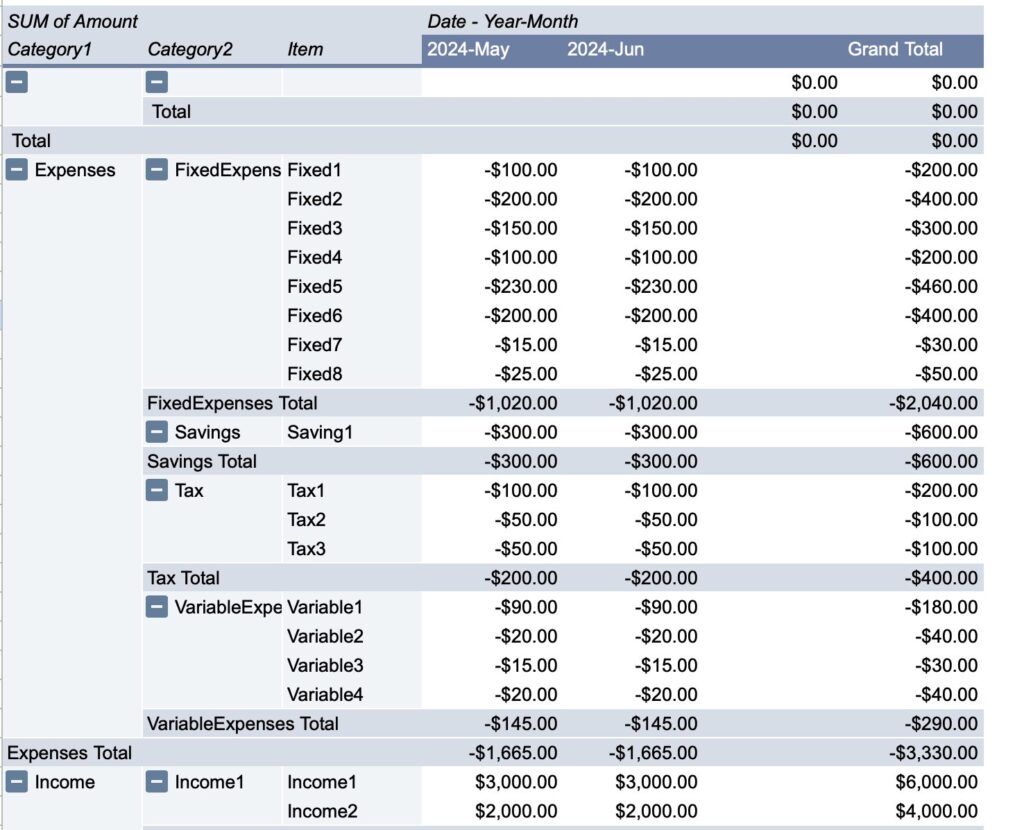
Table Grouping
You can group “year” and “month” to display by year.
Excel
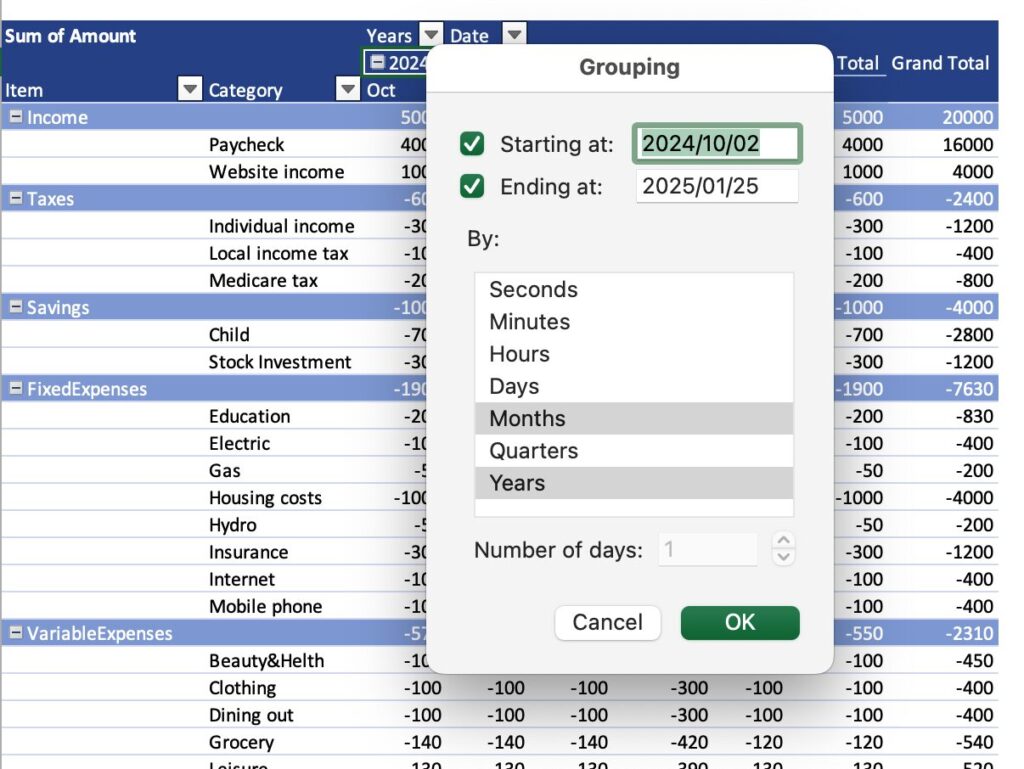
You can hide the month with the + and - buttons.
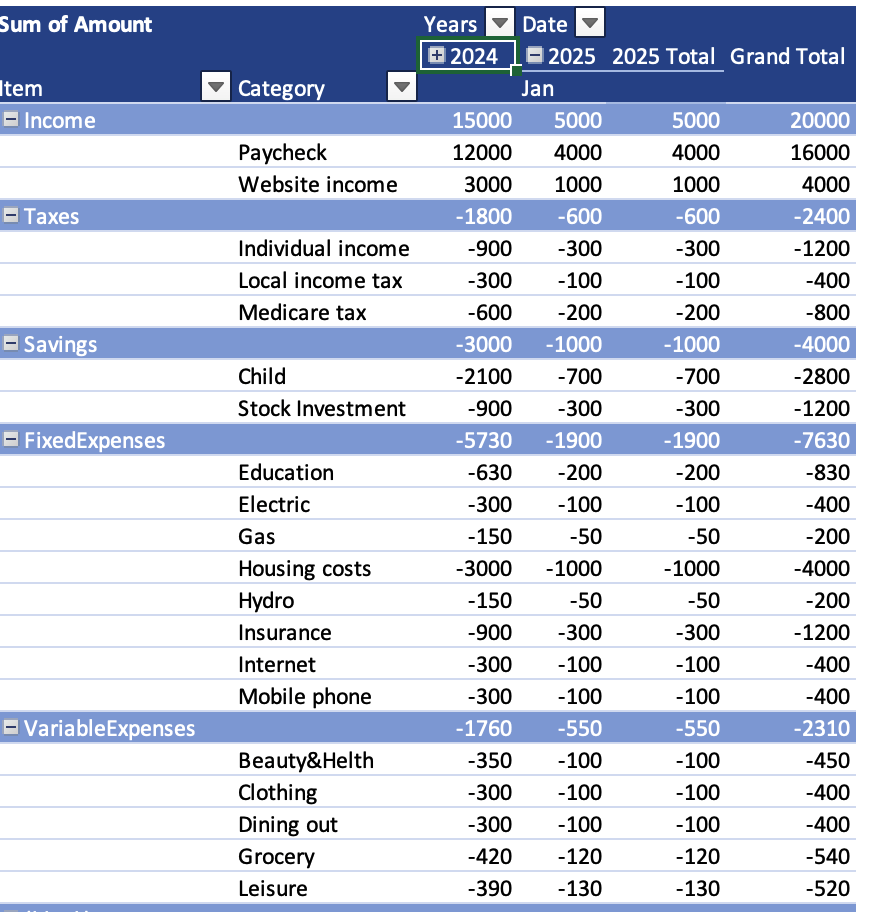
Spreadsheet
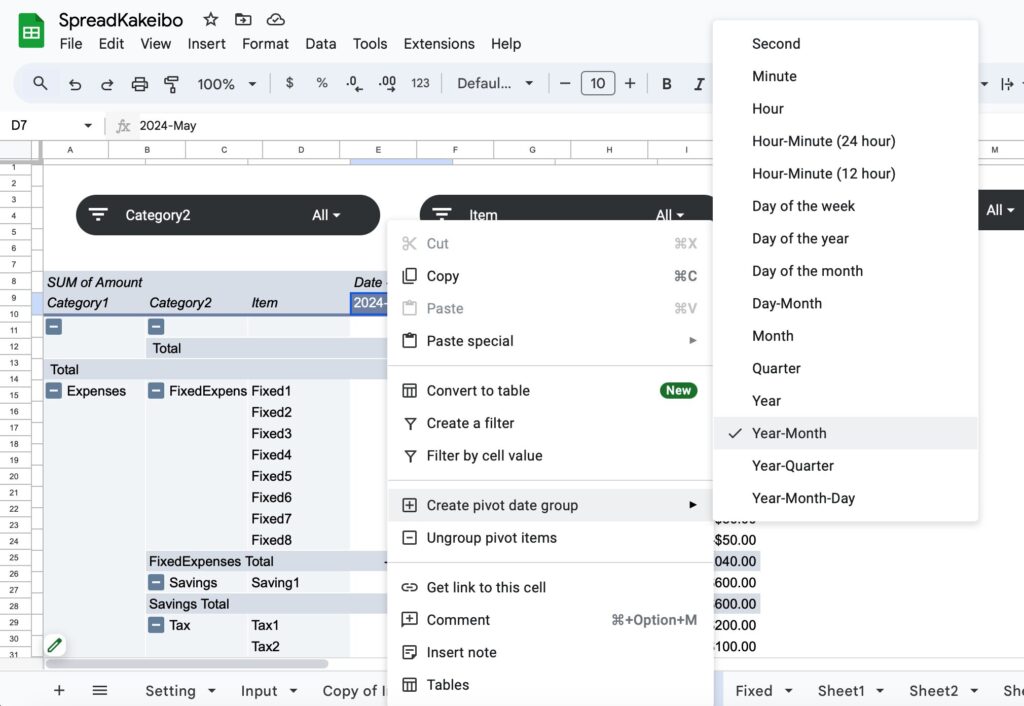
+There is no +/- button, so all of the months entered remain visible.
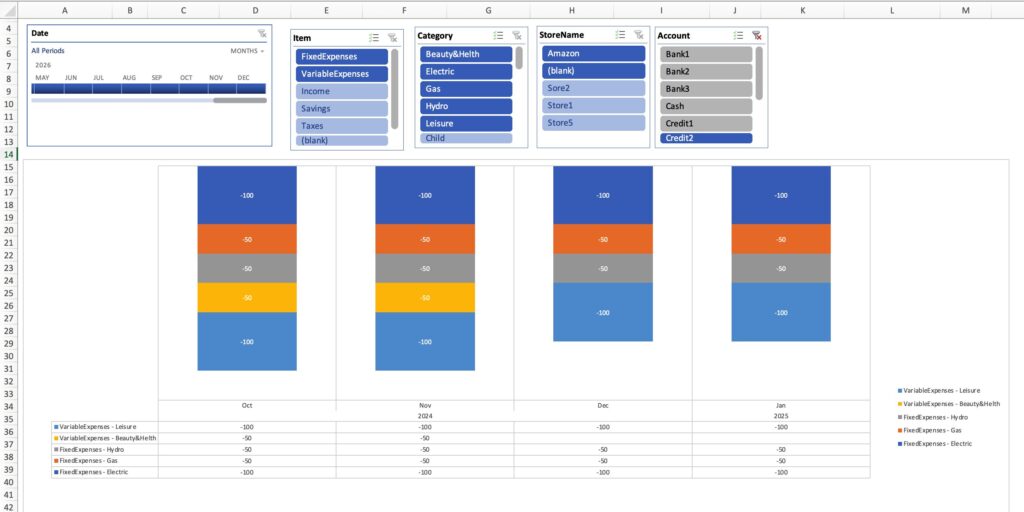
Pivot Graphs
This function creates a graph based on a pivot table.
Excel
Timelines and slicers can be used to display specific periods of time and specific items.
Spreadsheet
The spreadsheet does not have a pivot graph feature.
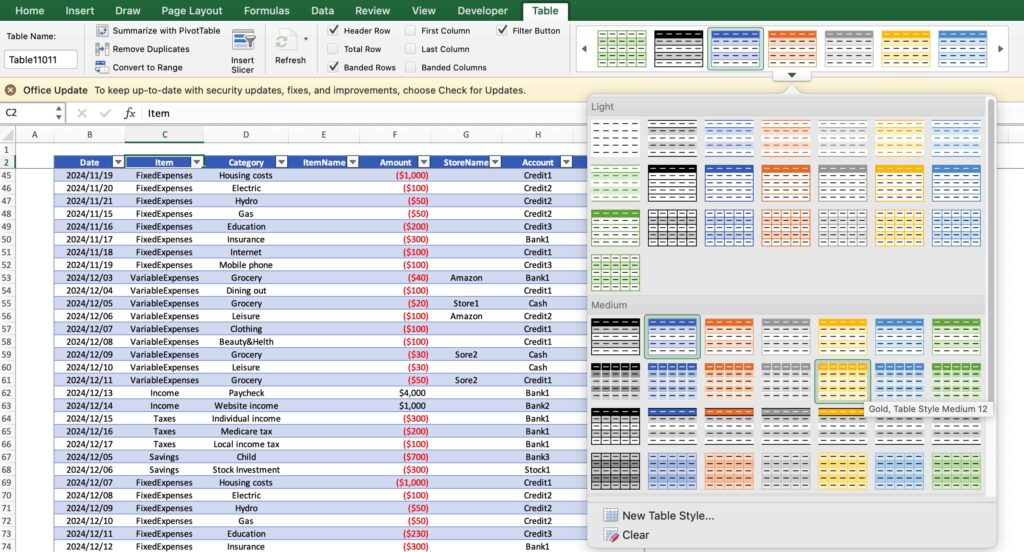
Design Selection
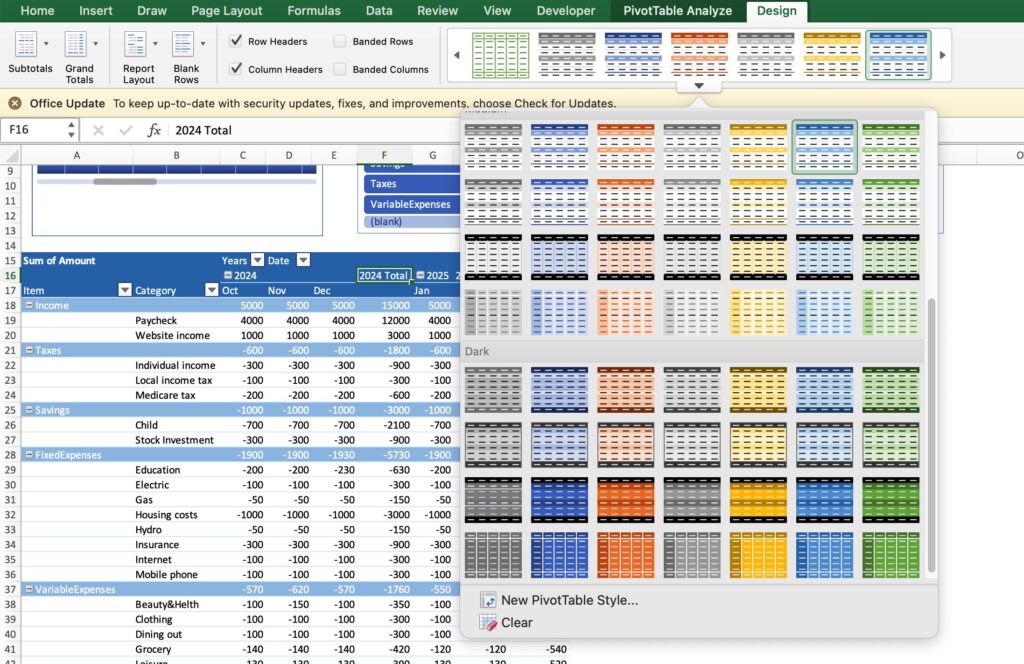
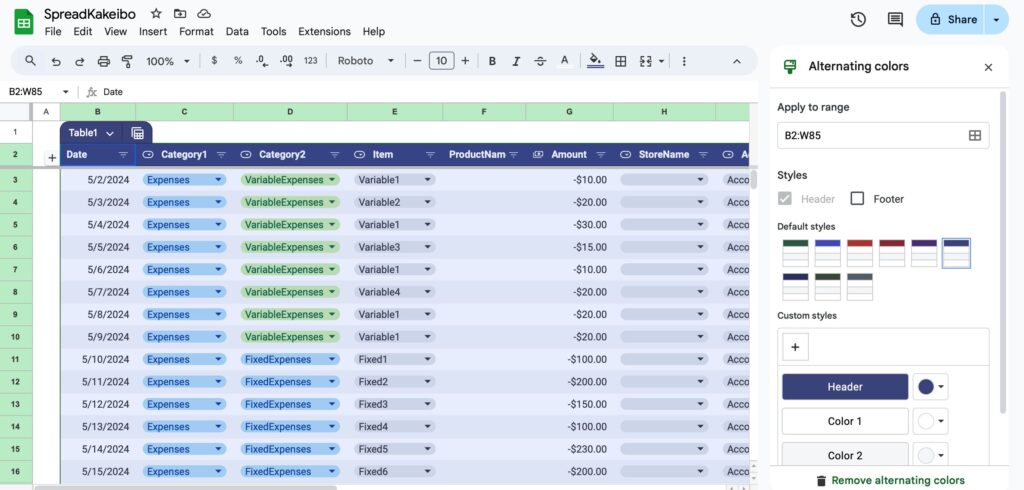
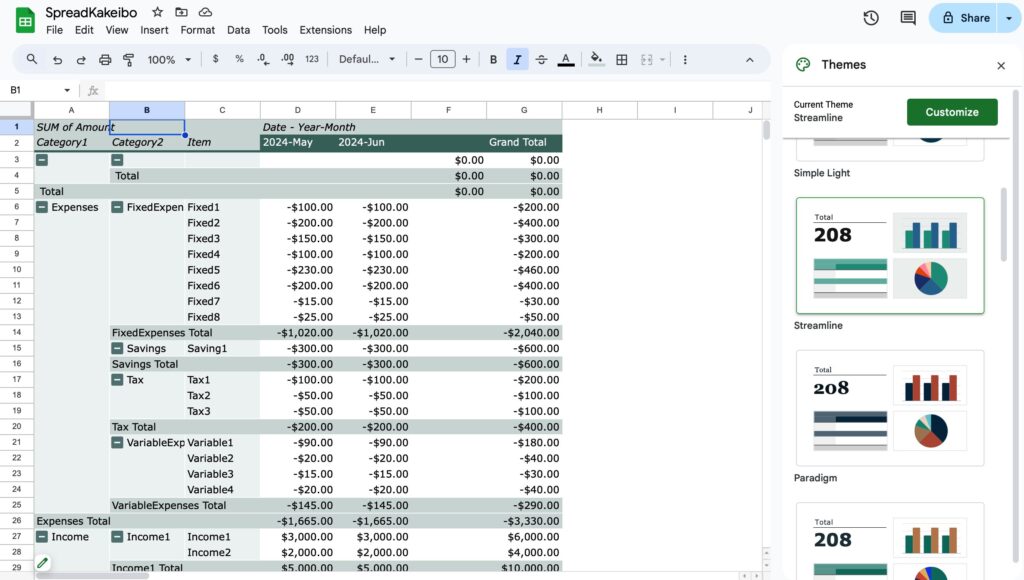
Both offer design choices, but Excel offers more detailed color schemes and formatting choices.
Excel
Table design
Pivot Table Design
Spreadsheet
Table design
Pivot Table Design
Recommended Type
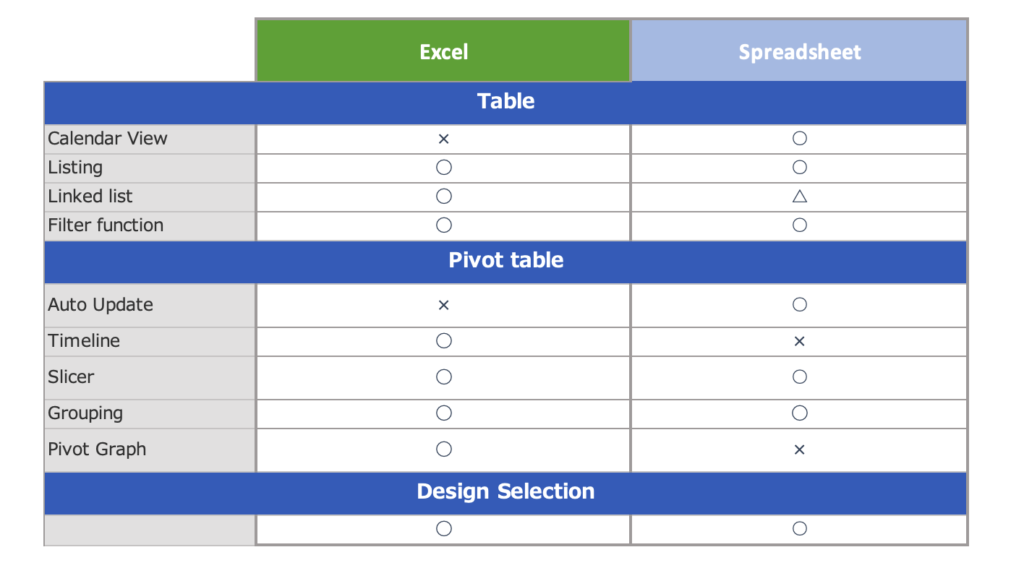
On the spreadsheet input sheet, the calendar view and color-coded lists are easy to read and facilitate daily input. However, there are also situations where it is necessary to set up interlocking lists, which can be a bit time-consuming.
On the other hand, Excel's pivot table is attractive in that it allows you to utilize the timeline function to display specific time periods and organize several years' worth of data by year. In addition, there is the ability to visualize certain items in graphs, which is ideal for those who want to do a thorough data analysis.
Recommended type of person for this type of work!
- Those for whom spreadsheets are suitable
Recommended for those who value ease of operation with input sheets.
Suitable for those who are familiar with operation and want simple management. - Excel is suitable for
Excel is perfect for those who want to analyze data thoroughly.
It is recommended for those who value long-term data management and visual analysis.
-
-
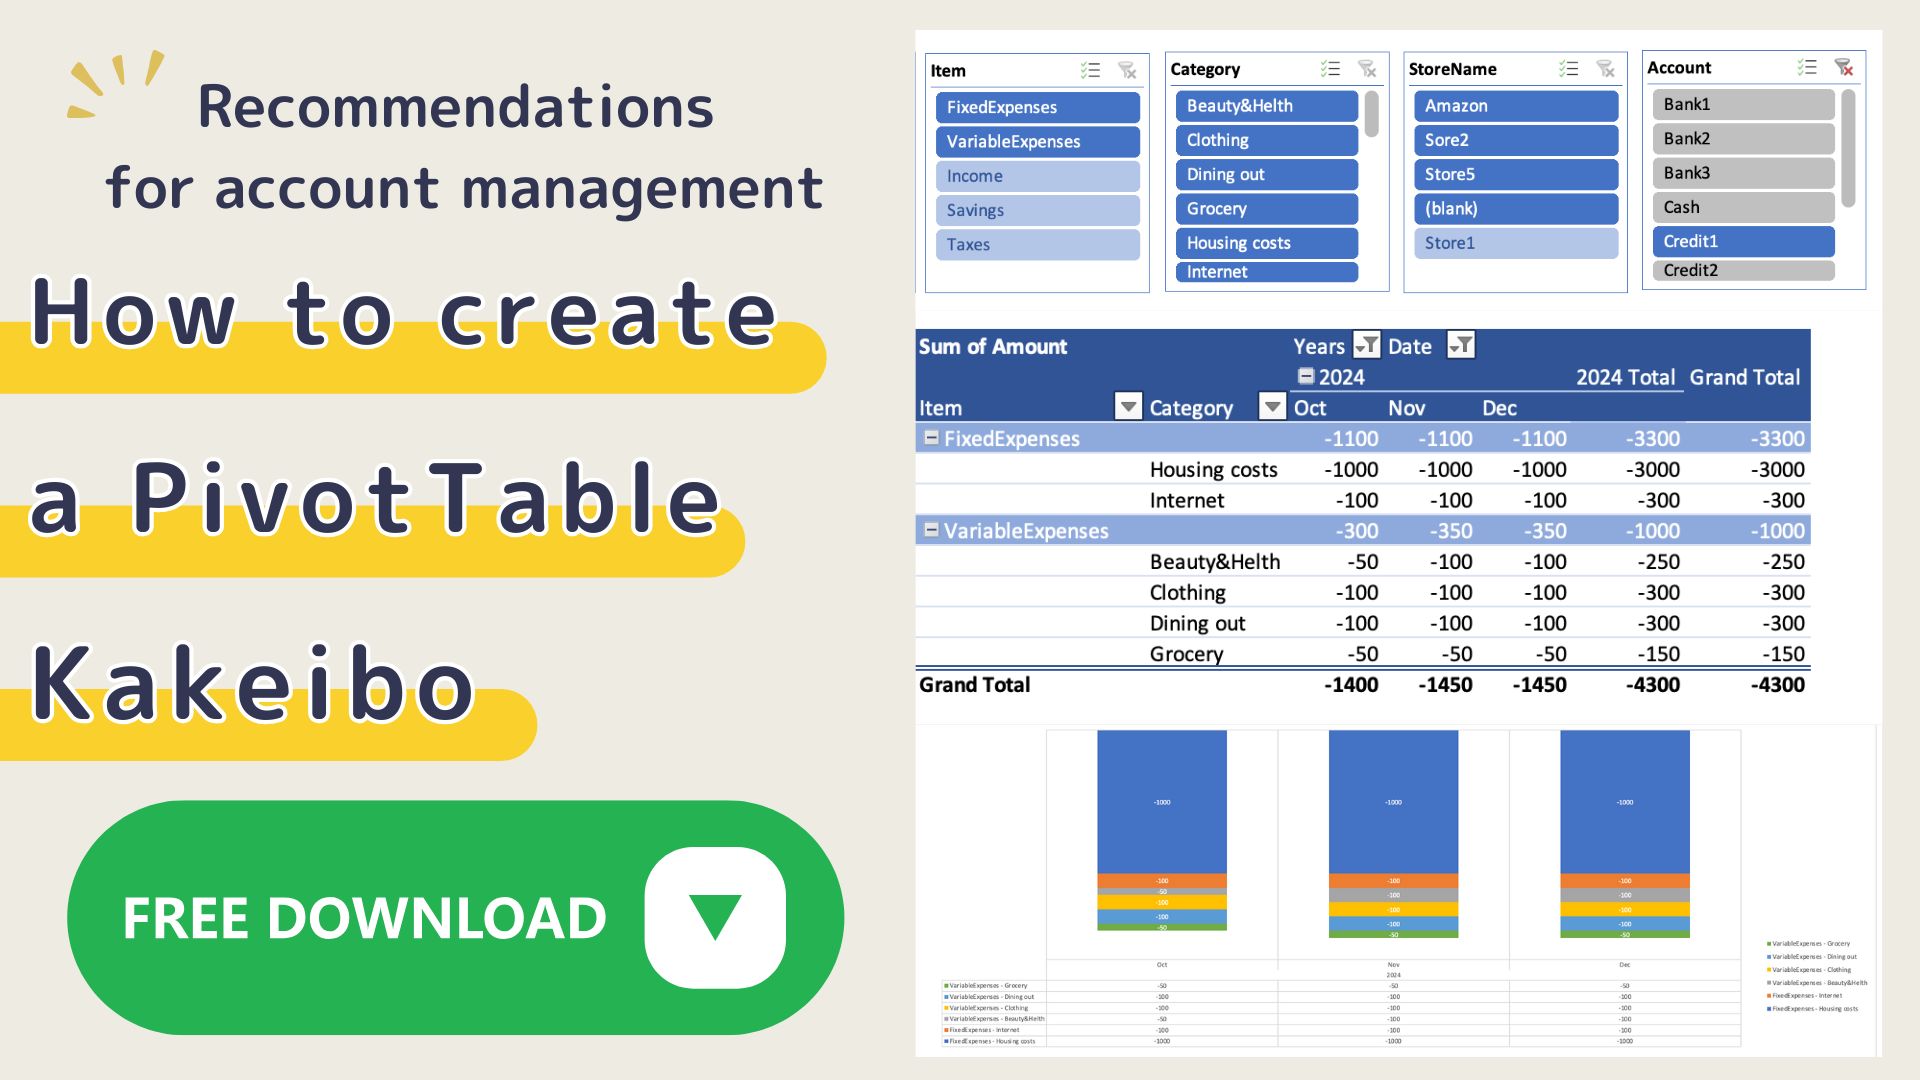
[Excel version] How to create a pivot table Kakeibo (sample template available)
This Kakeibo uses pivot tables that can aggregate and analyze large amounts of data. It is recommended for those who want to analyze data thoroughly, ...
-
-
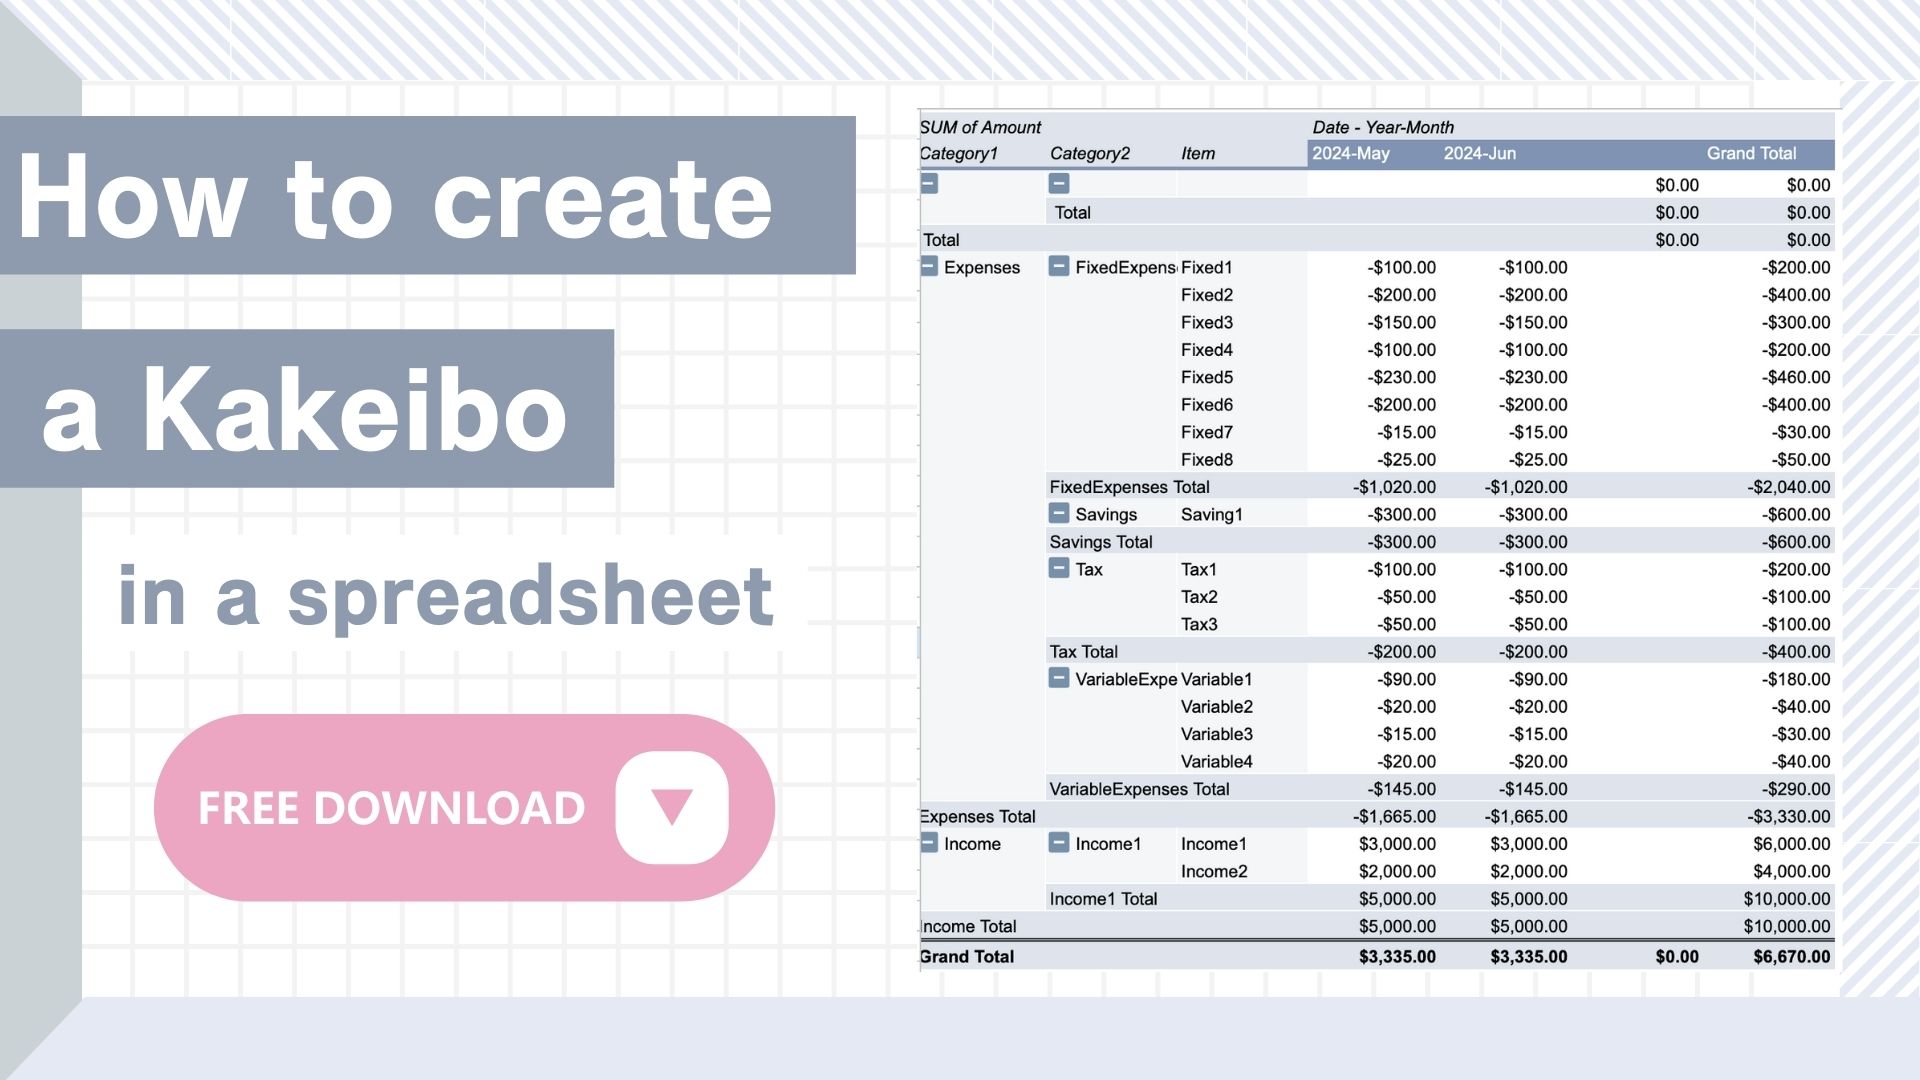
How to create a kakeibo in a spreadsheet
I don't know how to make a kakeibo in a spreadsheet. Do you have such a problem? Although spreadsheets and Excel look similar, there are ...
