I'm not sure if I've accurately tracked my income this month…
Do you have this concern?
When working as a freelancer, it's easy to get caught up in daily work and
“put off recording sales…”
“panic when tax filing season rolls around…”
Many people have had this experience.
Sales management is not just record keeping,
it is a “management tool” that helps you organize your work style and future.
It is designed to be user-friendly, covering the basic items needed for daily input and tax filing, without requiring complex operations or difficult knowledge.
Please note that this template does not support double-entry bookkeeping.
It prioritizes ease of input and practicality for those who want to “first understand their sales and expenses” and “visually confirm their cash flow.”
- Features of the Freelance Template
- Feature 1: Separate records for sales dates and payment dates
- Feature 2: Automatic calculation of tax categories and consumption tax
- Feature 3: Separate management of expenses by “date of use” and “payment date”
- Feature 4: Support for depreciation
- Feature 5: Graphical display of annual profits and monthly trends
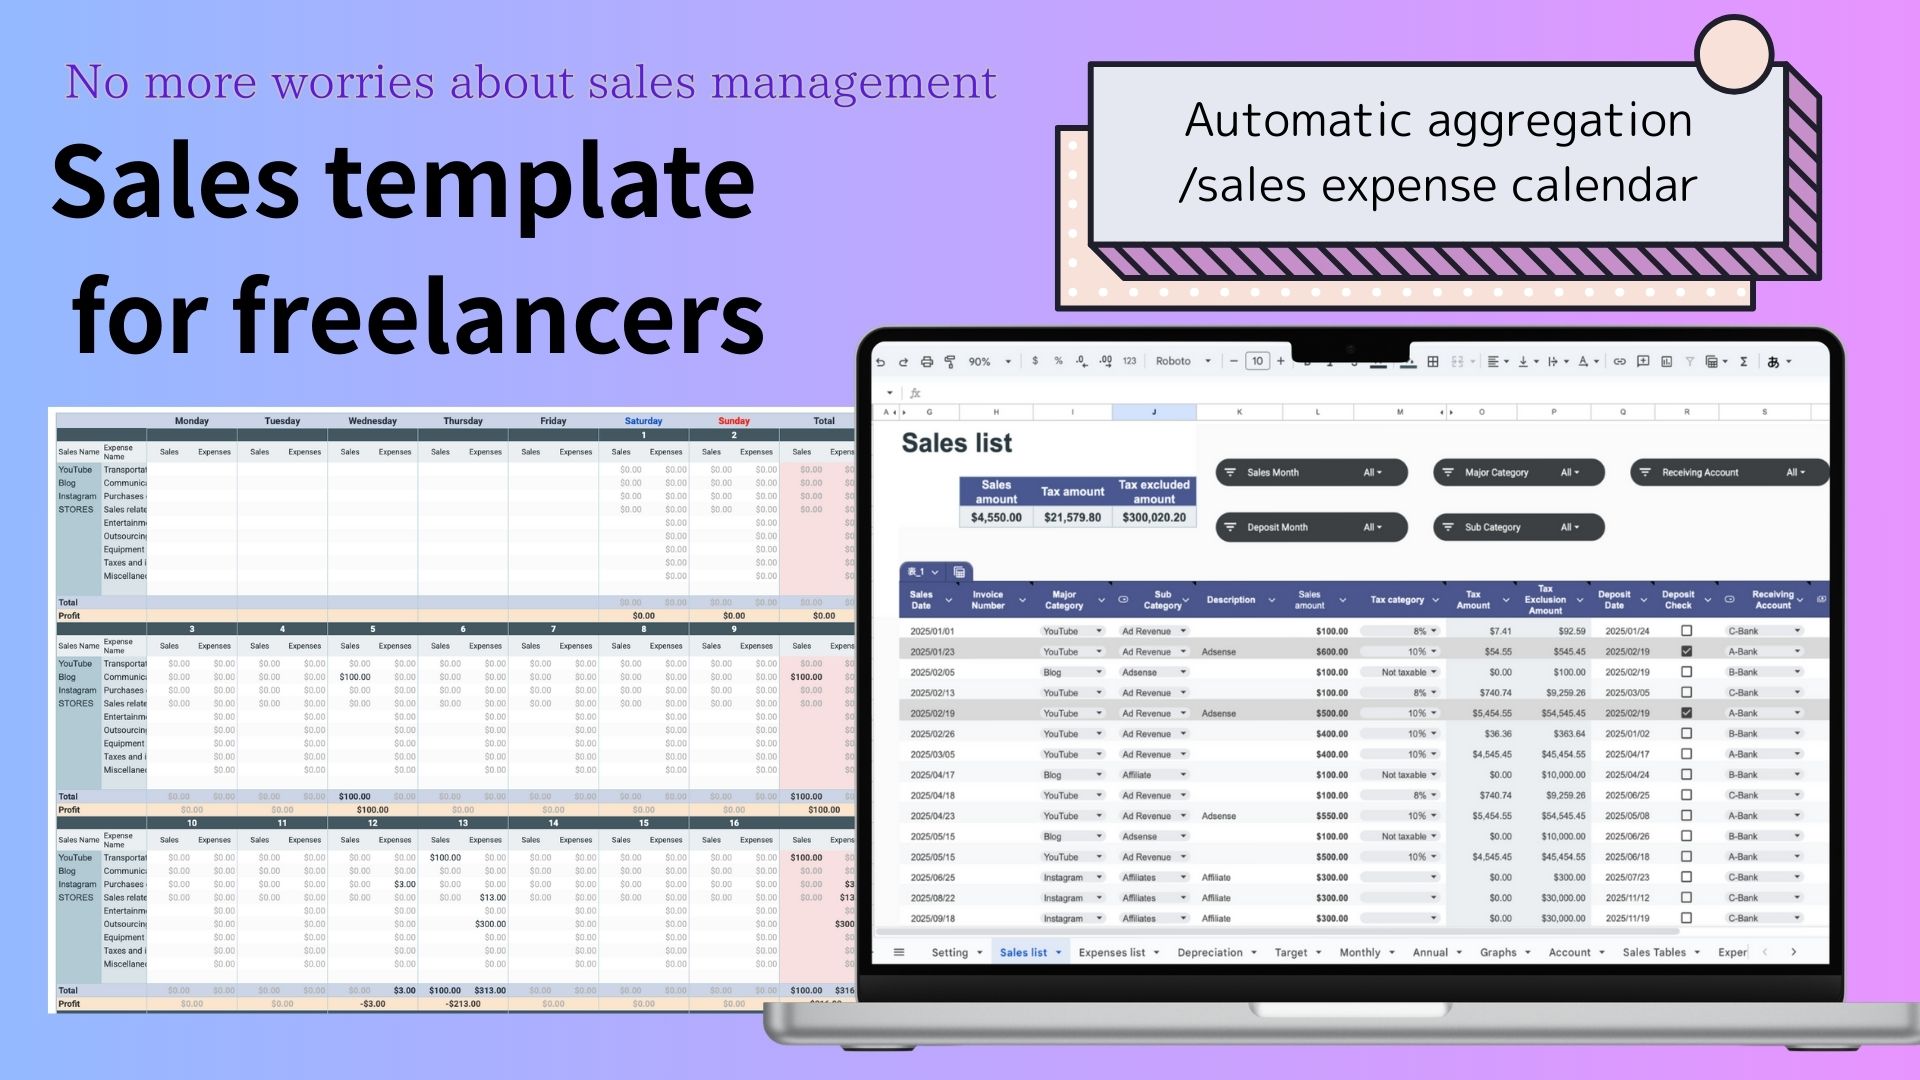
- Feature 6: Sales and expenses are easily visible in calendar format
- Feature 7: Goal achievement rates are visualized
- Comparison of free and paid versions
- How to use the template
- Download
Features of the Freelance Template
This template is a Google Spreadsheet designed to help freelancers and sole proprietors
easily and accurately track their sales, expenses, and profits.
Feature 1: Separate records for sales dates and payment dates
Visualize the discrepancy between “sales exist, but there is no money…” This is also useful for confirming unpaid invoices.

Feature 2: Automatic calculation of tax categories and consumption tax
Tax categories and tax amounts are displayed automatically. No specialized knowledge is required.

Feature 3: Separate management of expenses by “date of use” and “payment date”
You can also visualize monthly credit card payments.

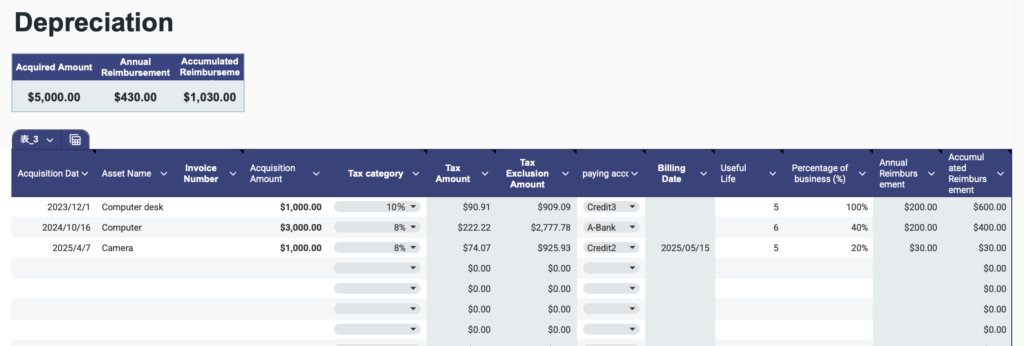
Feature 4: Support for depreciation
Automatically calculate depreciation expenses on a monthly basis for expensive computers and equipment.
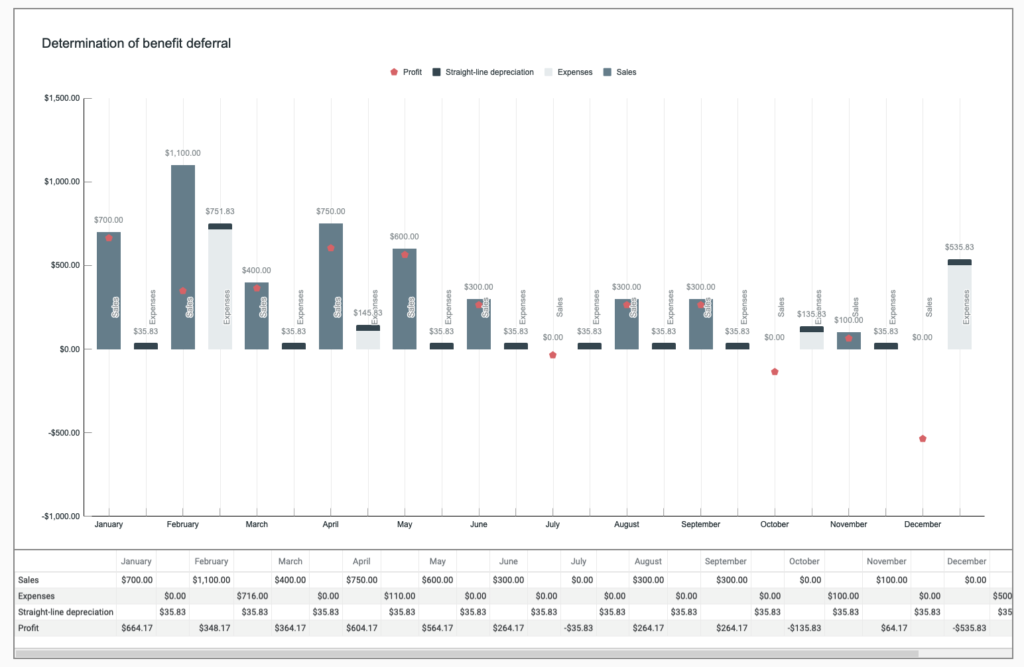
Feature 5: Graphical display of annual profits and monthly trends
Even if you are not good with numbers, you can intuitively grasp the balance of income and expenditure.
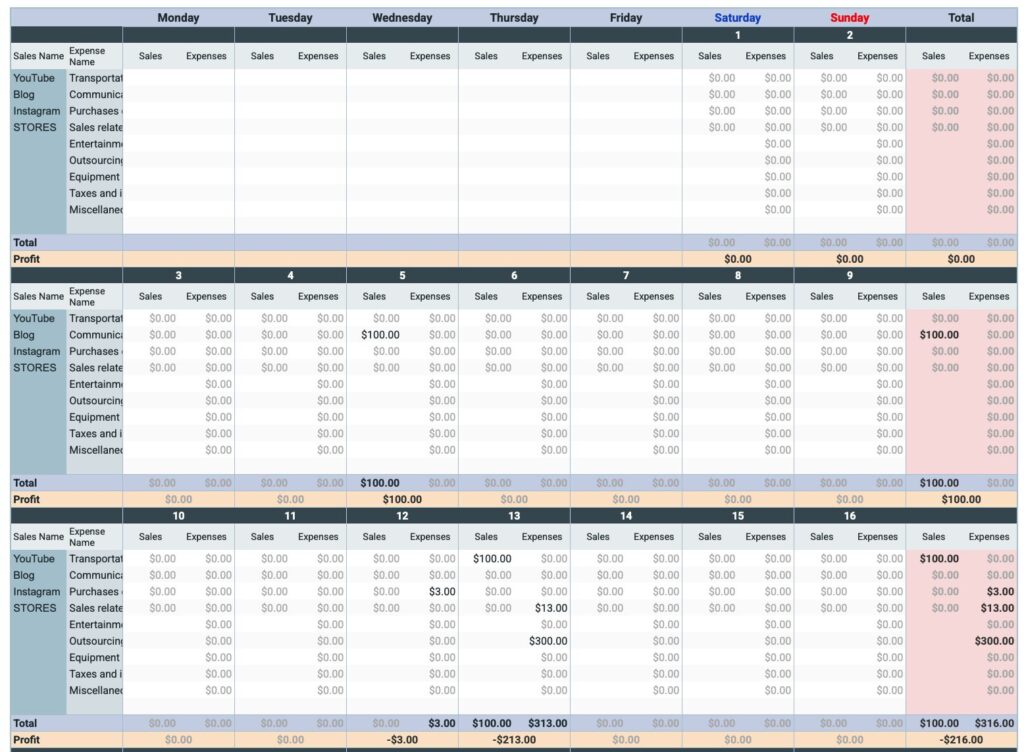
Feature 6: Sales and expenses are easily visible in calendar format
Daily sales, expenses, and profits are clearly displayed at a glance.
Amounts registered in the sales list and expense list are automatically reflected.
Feature 7: Goal achievement rates are visualized
Achievement rates are automatically calculated and can be checked at a glance with graphs.

Comparison of free and paid versions
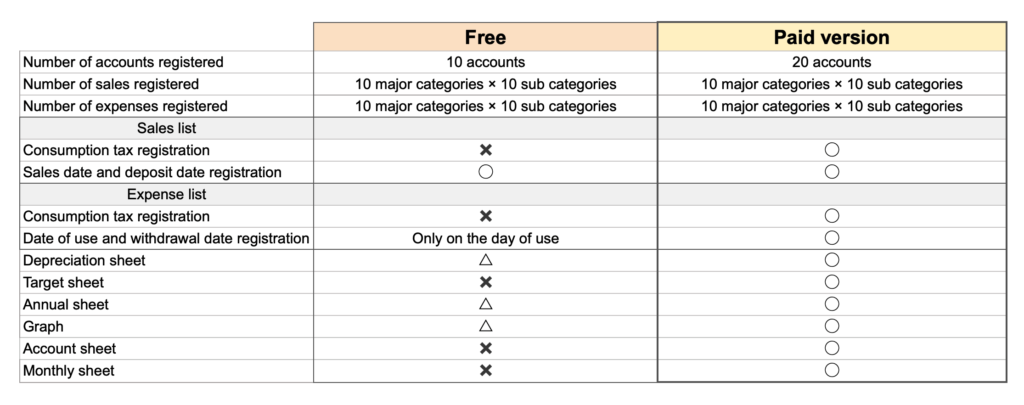
Annual Sheet
The free version only displays the total amount of sales, expenses, and depreciation expenses by month.
Graph Sheet
The free version only displays income and expenditure analysis.
How to use the template
Copy and save the file
This file is for viewing only.
Please make a copy before use.
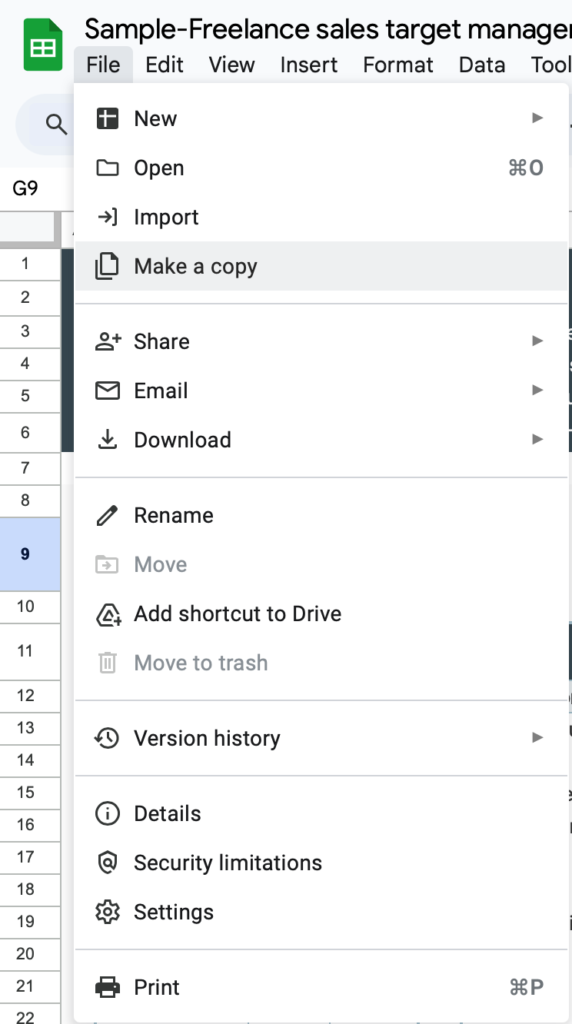
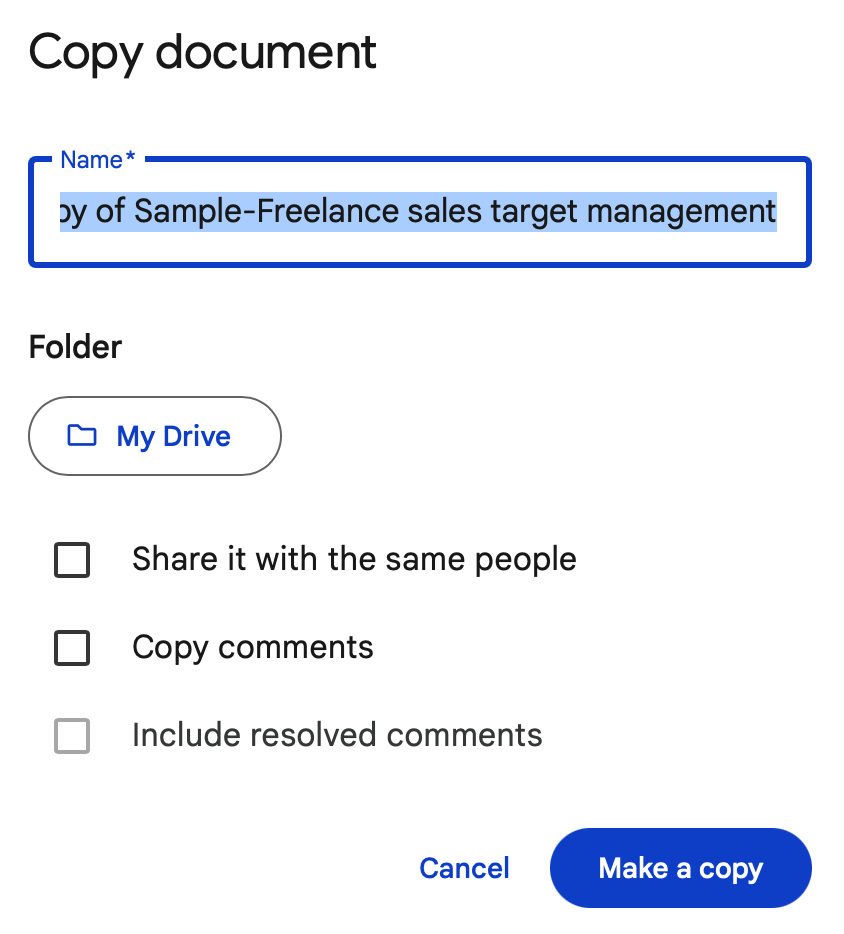
Settings sheet
Settings
- Account Management
Enter withdrawal and deposit accounts. - Expense Categories
Classify into major and sub categories. - Sales Management
Classify into major and minor categories. - Tax Management
- Select the calendar year.
Select the calendar year from the tab.
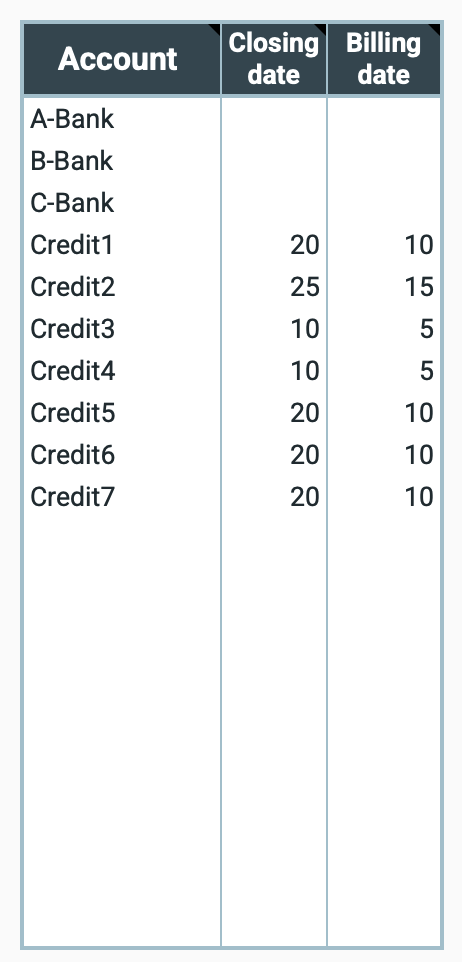
Account Management
Enter the account for receiving sales and the account for paying expenses.
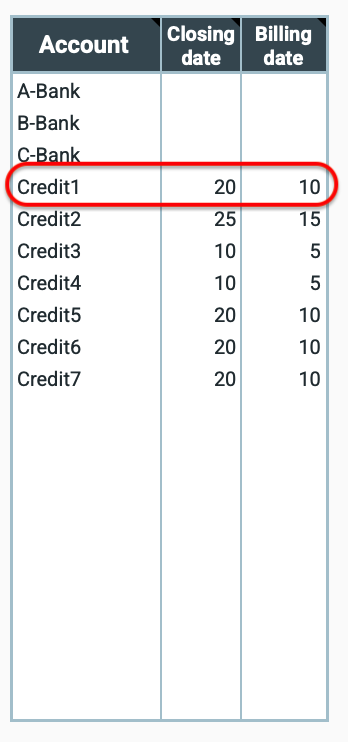
For credit cards, enter the closing date and billing date.
The “payment date” in the expense list is automatically displayed based on the closing date you set.
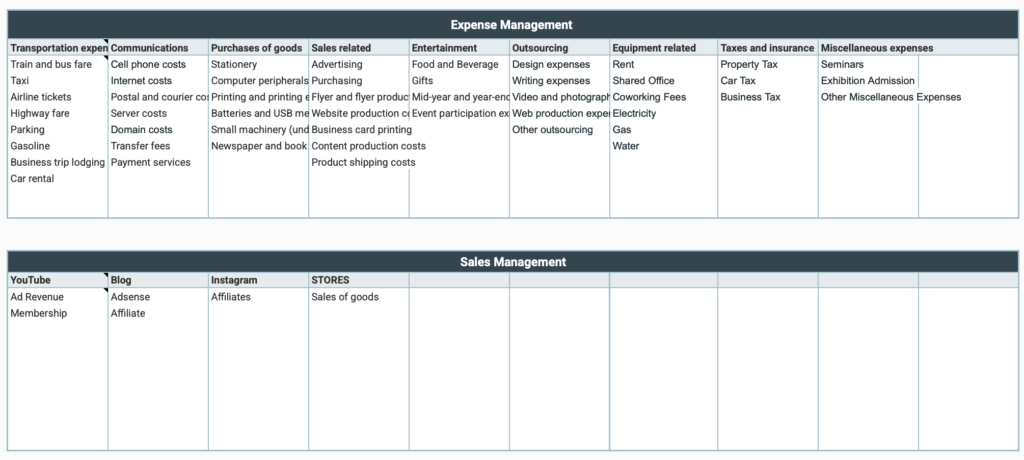
Expense categories, sales categories
Enter major and minor categories for both expenses and sales. (10 major categories x 10 sub categories)
Arrange sales management by platform, business partner, product, etc.
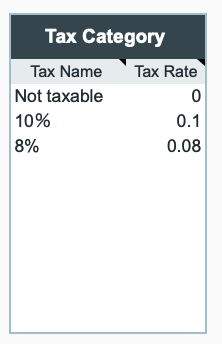
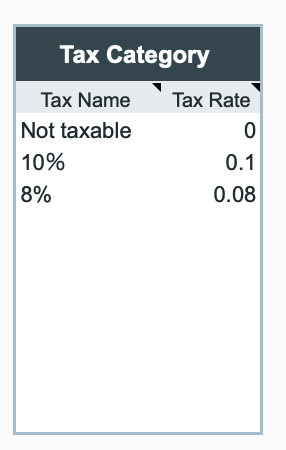
Tax Classification
This setting is used to display tax amounts in sales lists and expense lists.
Enter the tax name and tax rate. (A tax rate of 10% is 0.1, or 10/100.)
Select year
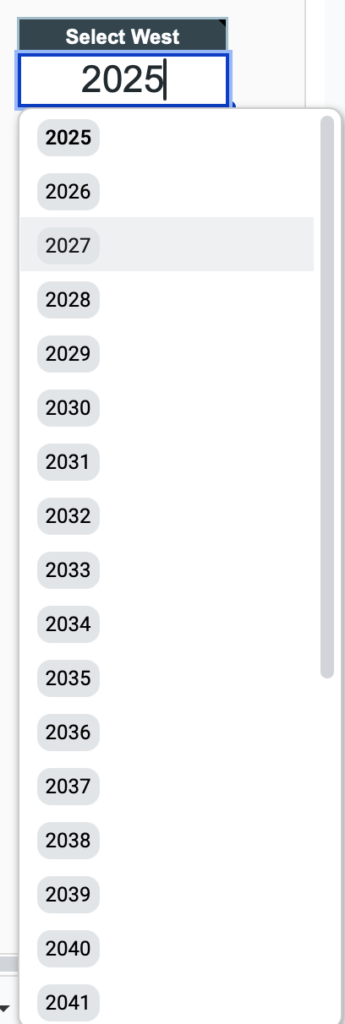
One file is used per year.
Please select the year you wish to use.
Sales list
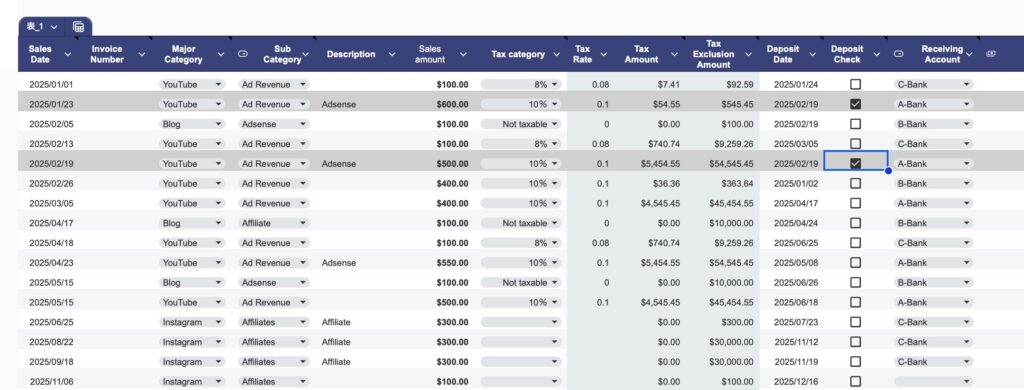
Enter sales amounts by date in the sales list.
Input fields
- Sales date: Select from the calendar.
- Invoice number: Enter if applicable.
- Major category-Select from the tab.
- Sub category-Select from the tab.
- Contents
- Sales Amount
- Tax Category - Select from the tab
- Tax Amount - Automatically displayed
- Tax-Excluded Amount - Automatically displayed
- Payment Date - Select from the calendar
- Receiving Account - Select from the tab
- Payment Check - Check this box after confirming payment.
- Notes
When you check the Payment Check box, the background color of that row will automatically change to gray.
Display total amount
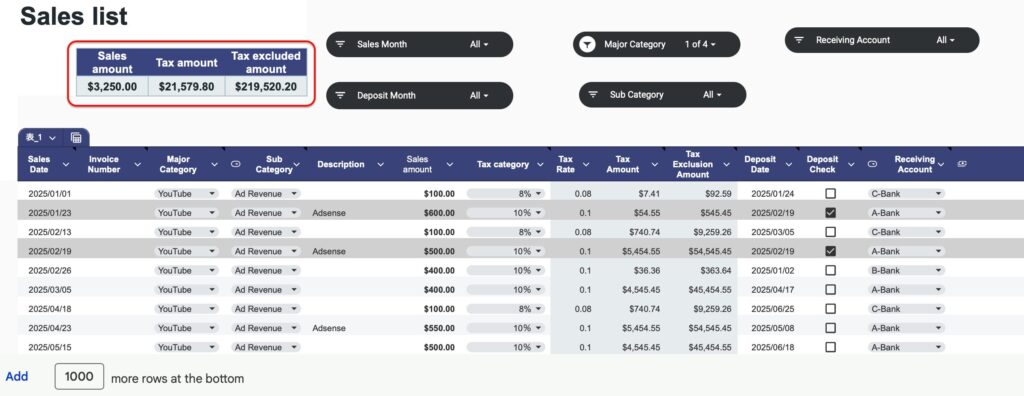
The total amounts for sales, taxes, and tax-excluded amounts are displayed at the top of the table.
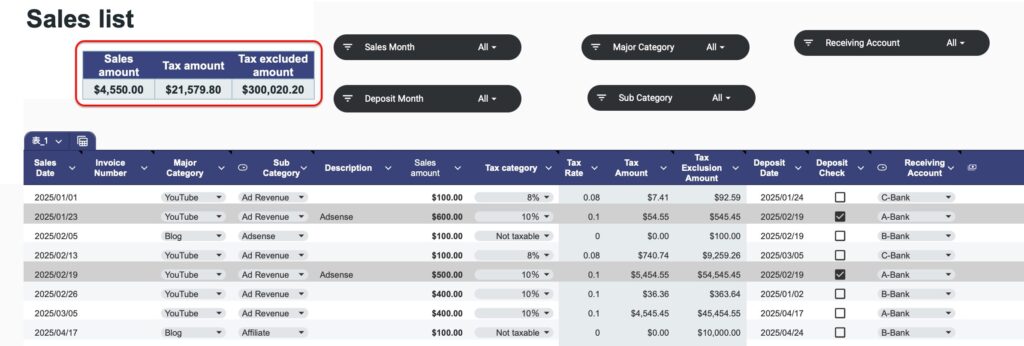
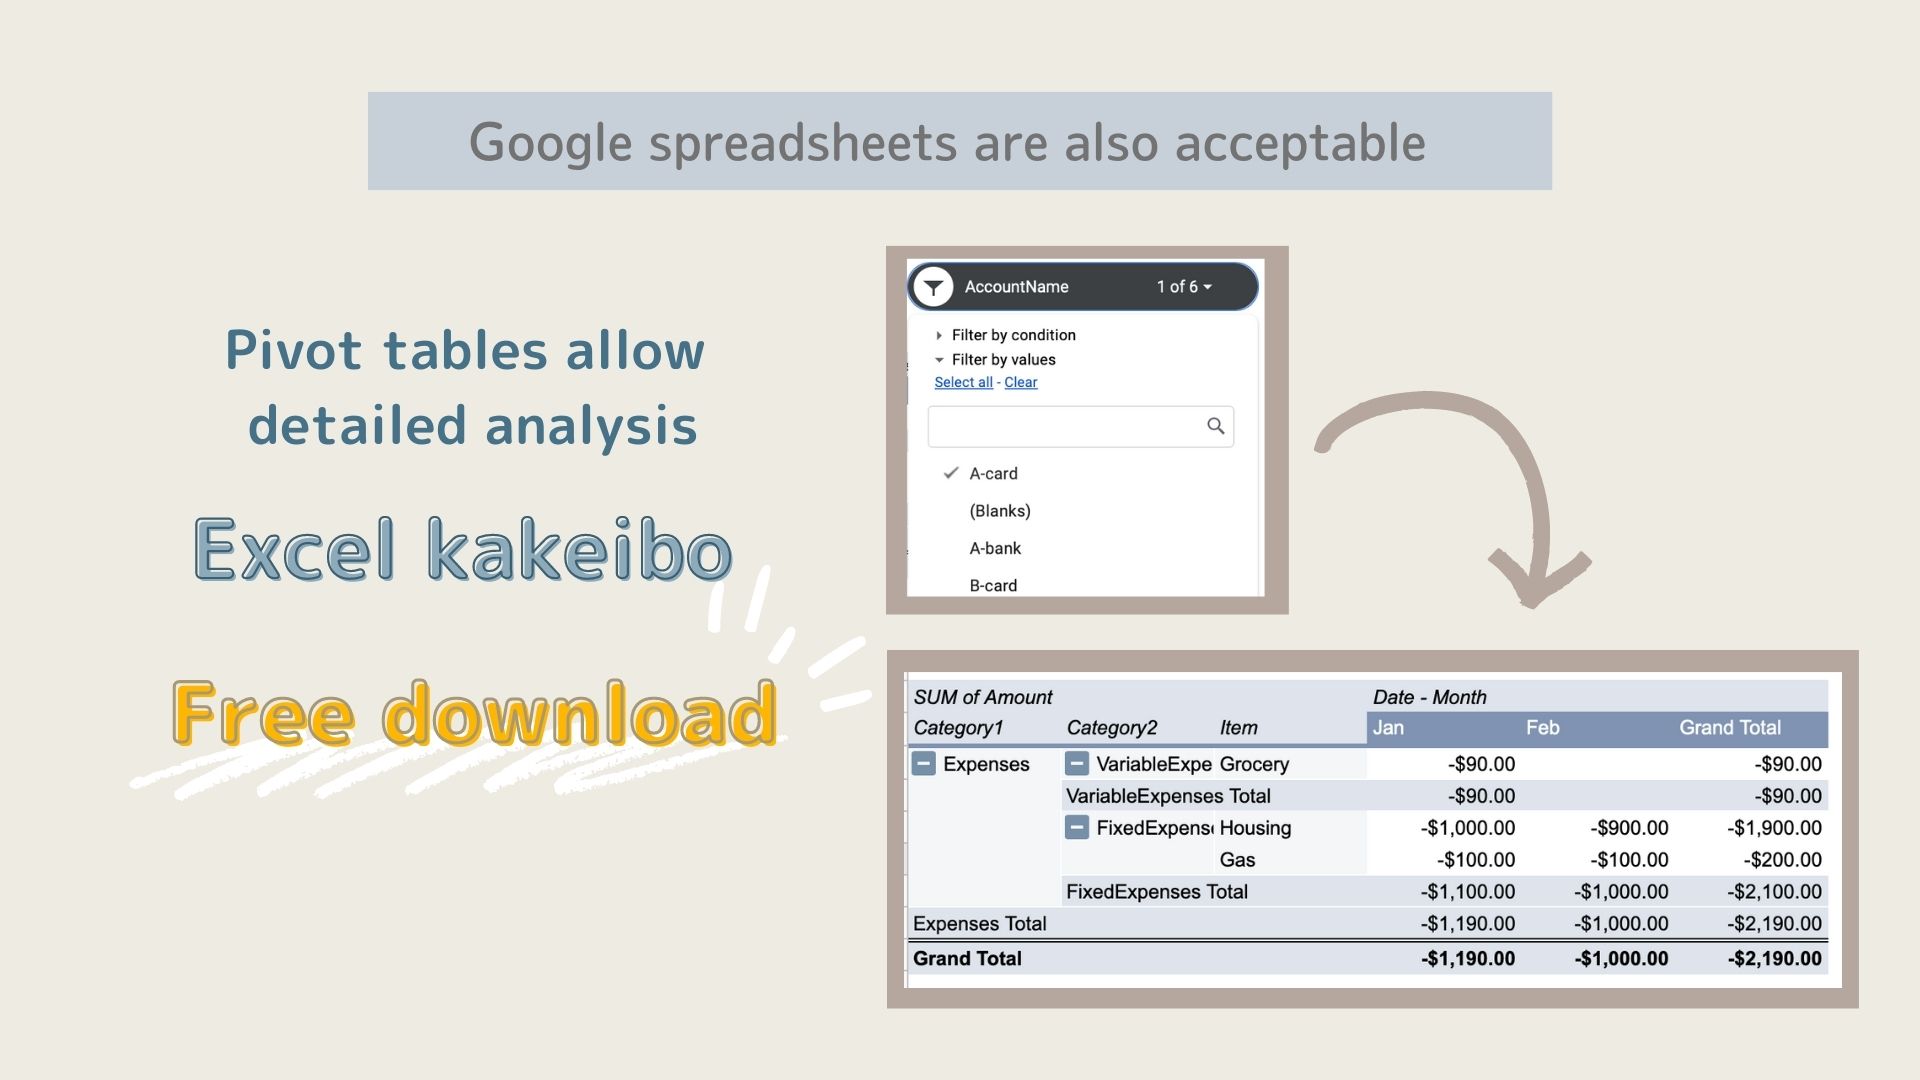
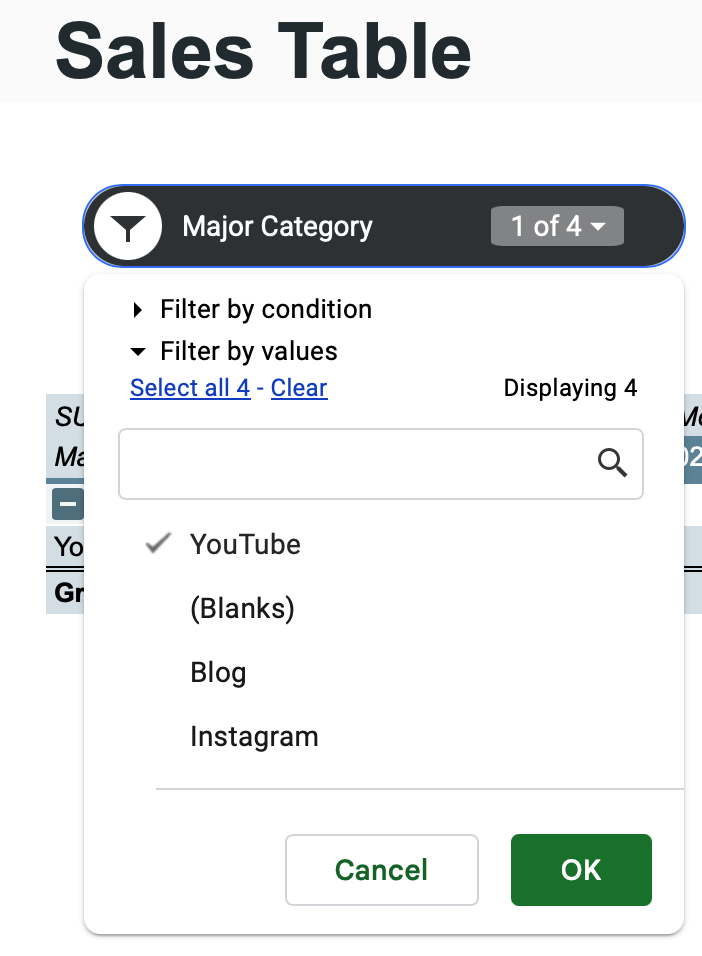
Slicer
You can use the slicer to display only specific items.
Click “All” on the slicer and check the items you want to search for.
To return to the previous view, click “Select All.”
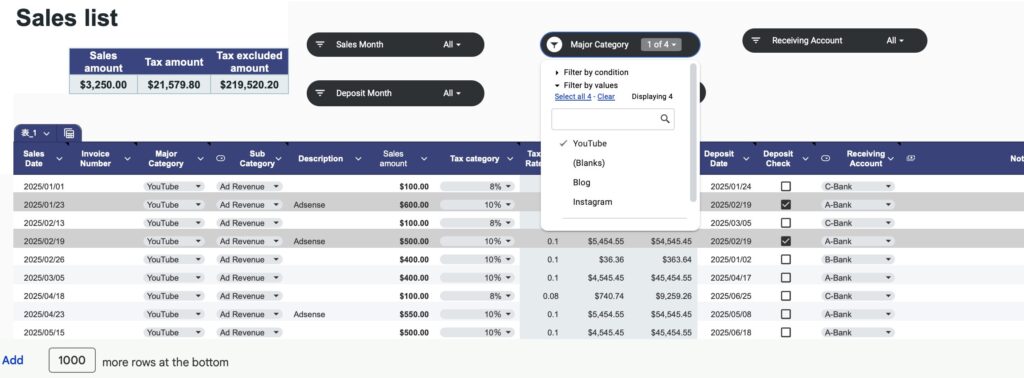
The selected items will be displayed.
The total amount of sales, tax, and tax-excluded amounts is the sum of the displayed items.
Expense list
Enter the expense amount by date in the expense list.
Input fields
- Date of use:Select from the calendar.
- Major category:Select from the tab.
- Sub category:Select from the tab.
- Expense details
- Expense amount
- Tax category: Select from the tab.
- Tax amount: Displayed automatically.
- Amount excluding tax: Displayed automatically.
- Payment date: Displayed automatically.
- Payment account: Select from the tab.
- Business partner
- Remarks

If the payment account is a credit card, the payment date will be displayed based on the closing date.
If the date of use is before the closing date, the billing date for the following month will be displayed, and if it is after the closing date, the billing date for the month after next will be displayed.

Display total amount
The total amounts for expenses, taxes, and tax-excluded amounts are displayed at the top of the table.

Slicer
You can use the slicer to display only specific items.
Click “All” on the slicer and check the items you want to search for.
To return, click “Select All.”

The selected items will be displayed.
The total amount of expenses, taxes, and tax-excluded amounts is the sum of the displayed items.
Depreciation sheet
Display items
- Acquisition date: Select the purchase date from the calendar.
- Asset name: Enter the name of the purchased item.
- Acquisition amount: Enter the purchase amount.
- Tax category: Select from the tab.
- Consumption tax: Automatically entered.
- Amount excluding tax: Automatically entered.
- Payment account: Select from the tab.
- Payment date: Automatically entered.
- Useful Life :Enter the useful life
- Business Proportion : Enter the business proportion in %
- Annual Depreciation Expense – Automatically calculates the annual depreciation expense
- Cumulative Depreciation Expense – Automatically calculates the cumulative depreciation expense from the purchase year
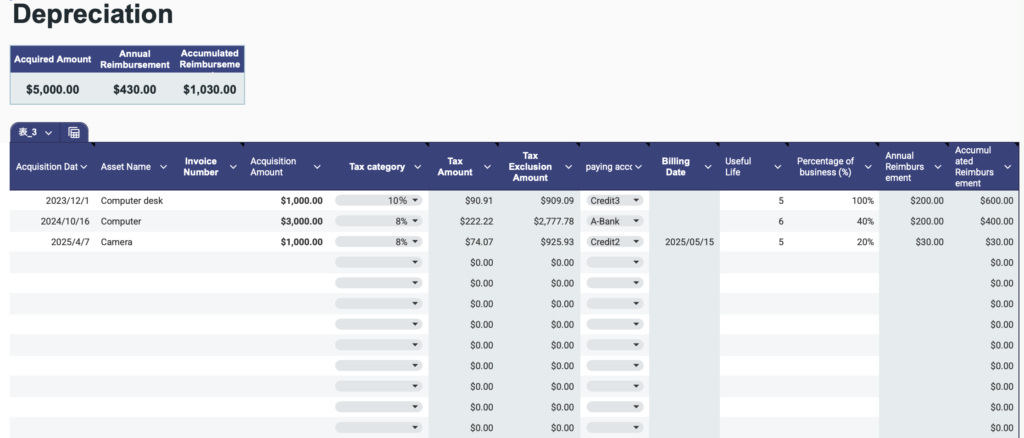
On the depreciation expense sheet, you can register not only the calendar year selected on the settings sheet, but also assets acquired before that date retroactively.
The payment date is displayed only when the purchase date is the calendar year selected on the settings sheet.
Monthly sheet
There is one sheet for each month.
Select the month you want to analyze from the month tab.
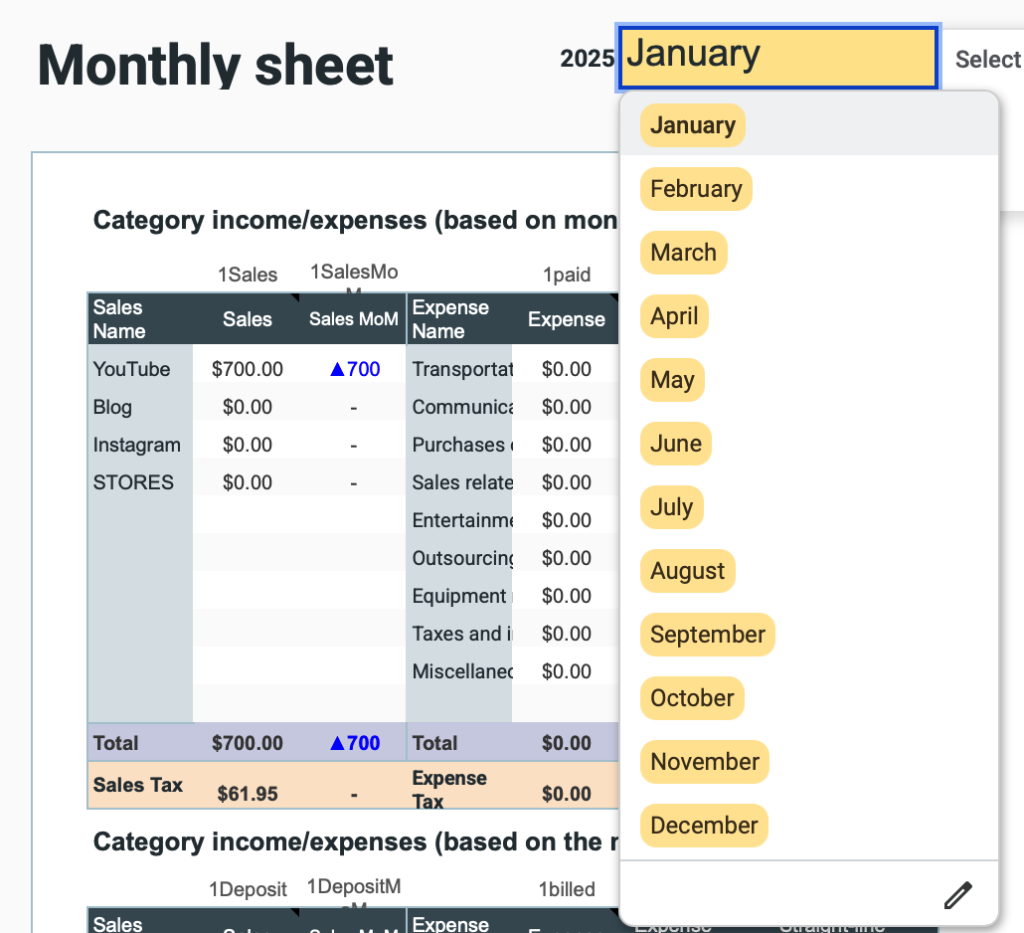
Display items
- Category-specific income and expenditure amounts and graphs
- Sales and expense calendar (based on date of occurrence)
- Weekly sales and expense graphs
- Category-specific sales and expense graphs
- Sales and expense amounts by subcategory
- Account-specific deposit and withdrawal amounts and graphs
Category-specific income and expenditure
Income and expenditure amounts are displayed classified by month of occurrence and month of deposit or withdrawal.
Income and expenditure for tax returns are displayed as the annual depreciation expense divided by 12.
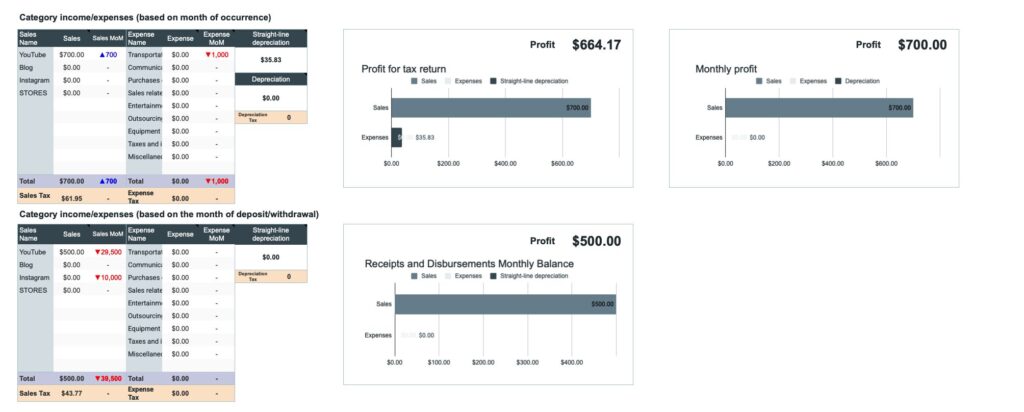
Sales and Expense Calendar (Based on Date of Occurrence)
Sales, expenses, and profits are displayed on a calendar based on the date of occurrence.

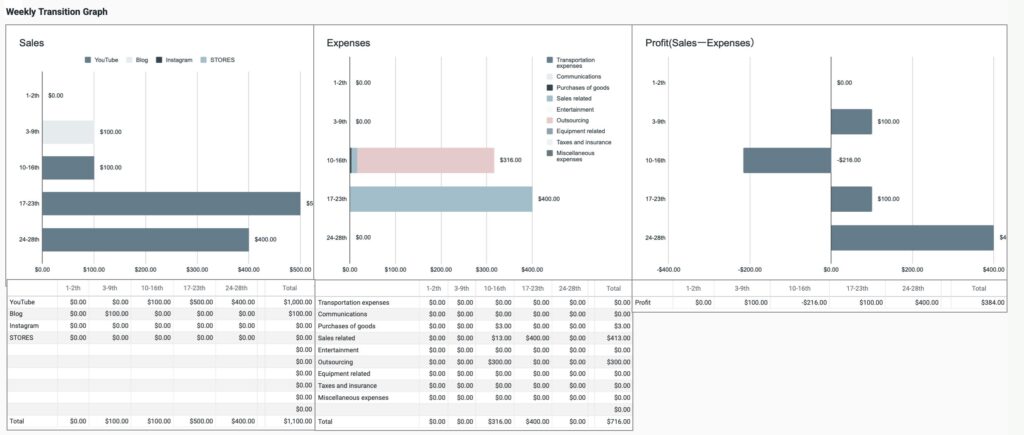
Weekly trend graph
Displays weekly trends in sales, expenses, and profits in graph form.
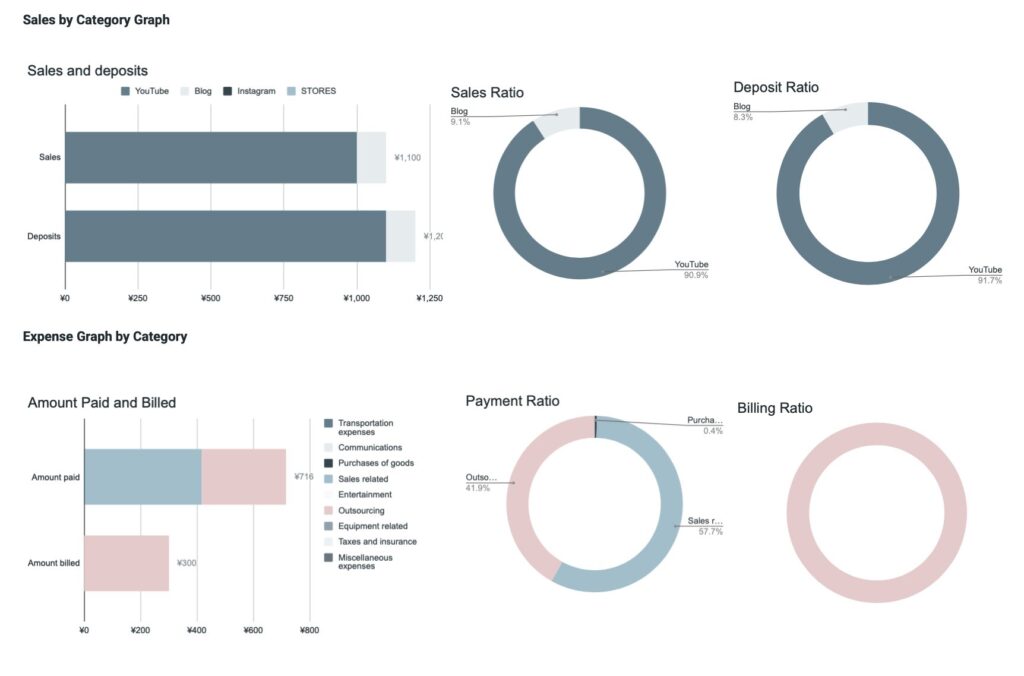
Category-specific sales graph, category-specific expense graph
- Sales amount and payment amount (accumulated bar graph)
- Major category-specific sales ratio (pie chart)
- Major category-specific payment ratio (pie chart)
- Payment amount and invoice amount (accumulated bar graph)
- Major category-specific payment expense amount ratio (pie chart)
- Major category-specific invoice expense amount ratio (pie chart)
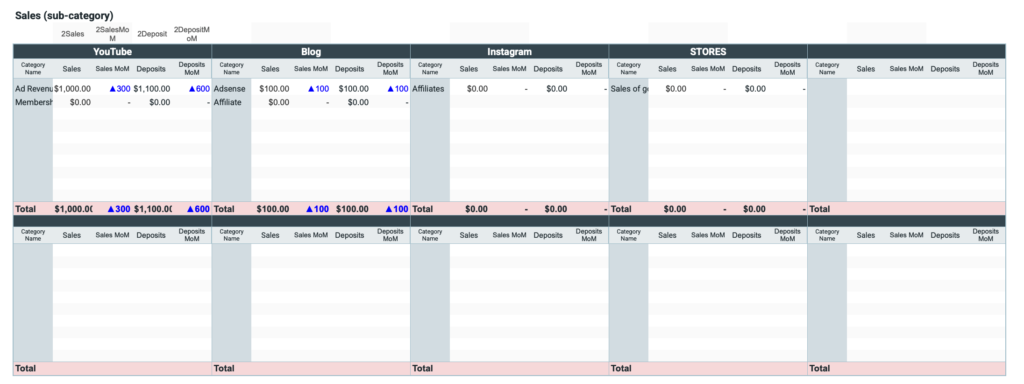
Sales amounts by subcategory
Displays sales amounts by subcategory, sales comparisons with the previous month, payment amounts, and payment comparisons with the previous month.
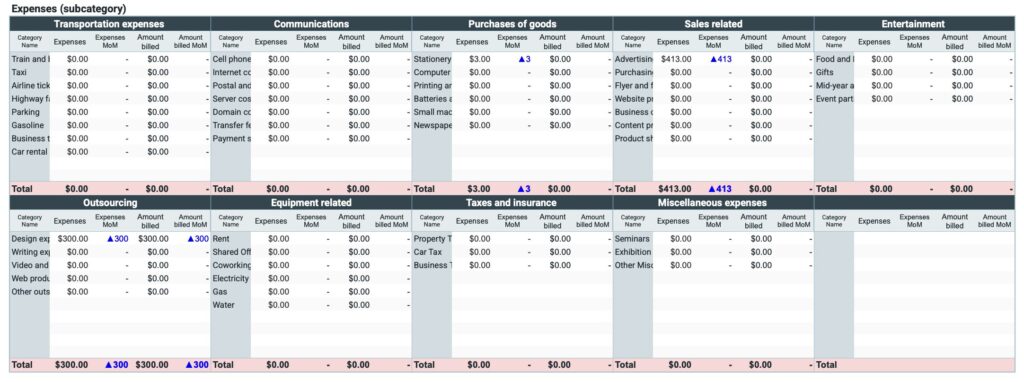
Expense amounts by subcategory
Displays expense amounts by subcategory, expense comparisons with the previous month, payment amounts, and payment comparisons with the previous month.
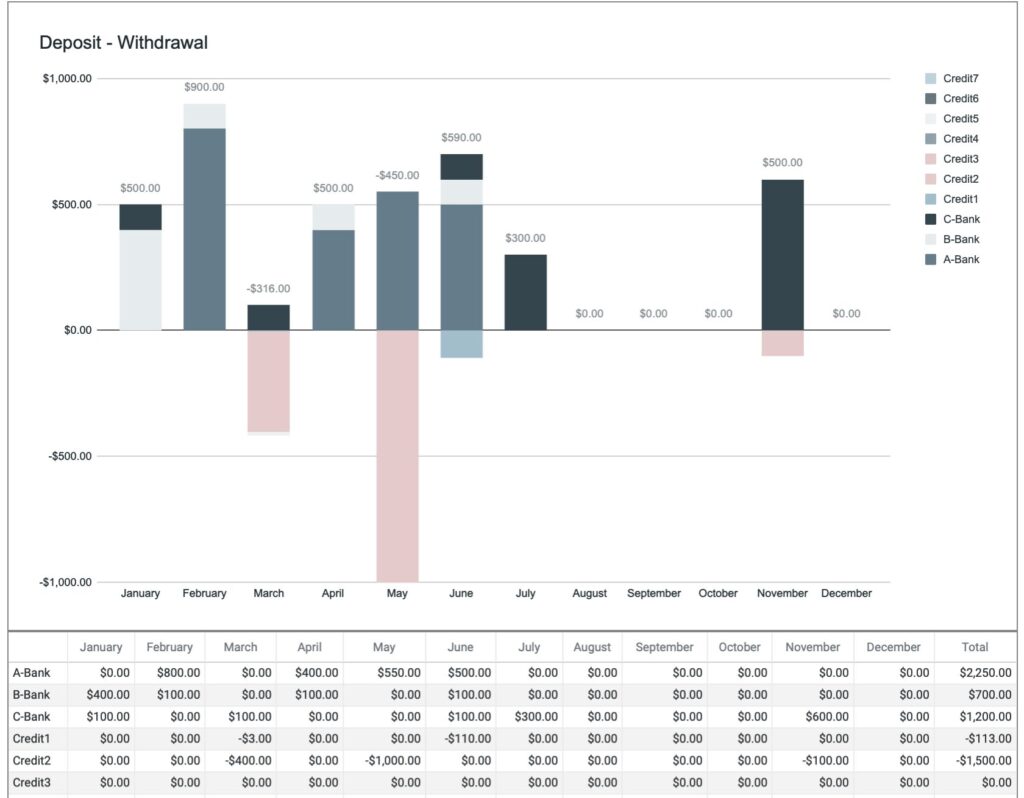
Deposit and withdrawal amounts by account and graph
Displays deposit amounts, withdrawal amounts, and deposit minus withdrawal amounts by account.
The deposit ratio and withdrawal ratio for each account are visualized in pie charts.
In addition, the difference between the deposit amount and withdrawal amount for each account is displayed in bar charts.

Annual sheet
The annual sheet displays sales, expenses, and depreciation expenses by month in a list format, allowing you to visually grasp the trends over the course of a year.
Profit trends for tax returns
Sales, expenses, and depreciation expenses are displayed based on the month in which they occurred.
Depreciation expenses are divided evenly over 12 months and displayed as monthly expenses.
Profit: Sales - (Expenses + Fixed depreciation expenses)

Profit trends by month of occurrence and billing month
Sales, expenses, depreciation, and profits are displayed by month of occurrence and month of deposit/withdrawal.

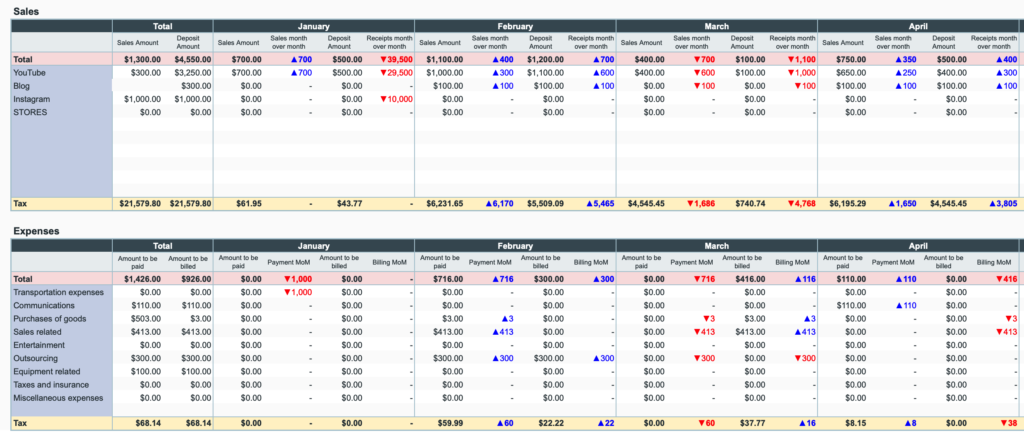
Sales and expense trends by major category
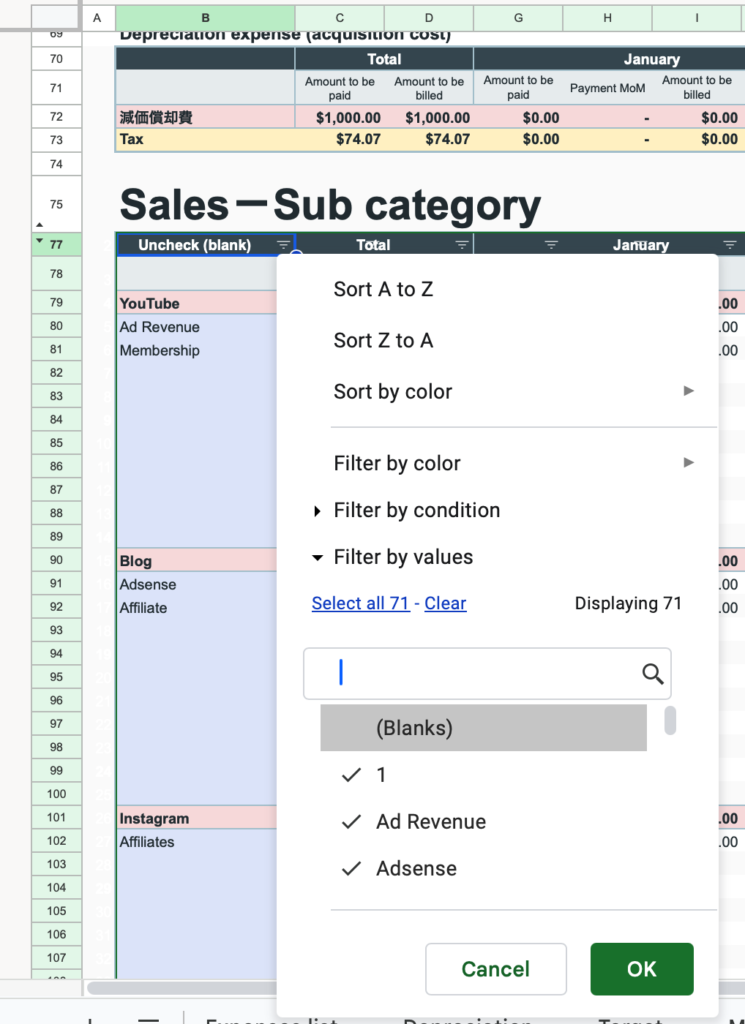
Sales and expense trends by subcategory
Click on the filter in cell B77 and uncheck “Blank.”
The blank rows will be hidden.
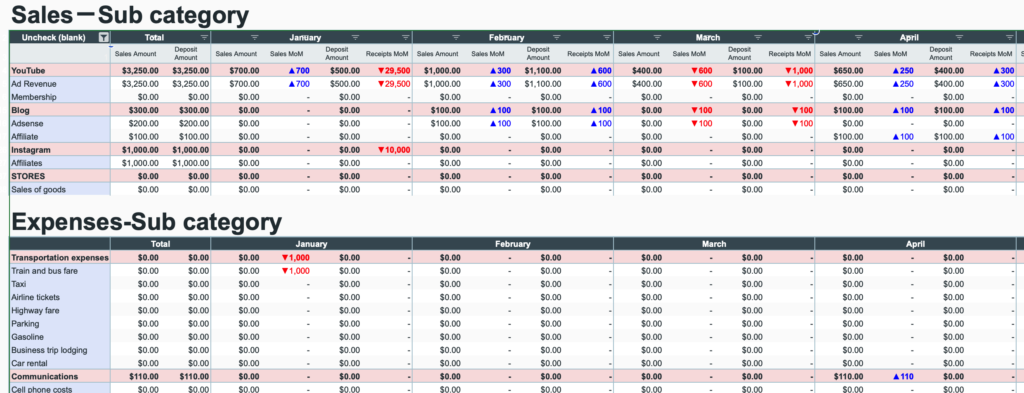
How to display the month-on-month change for January
Click the “+” button at the top.
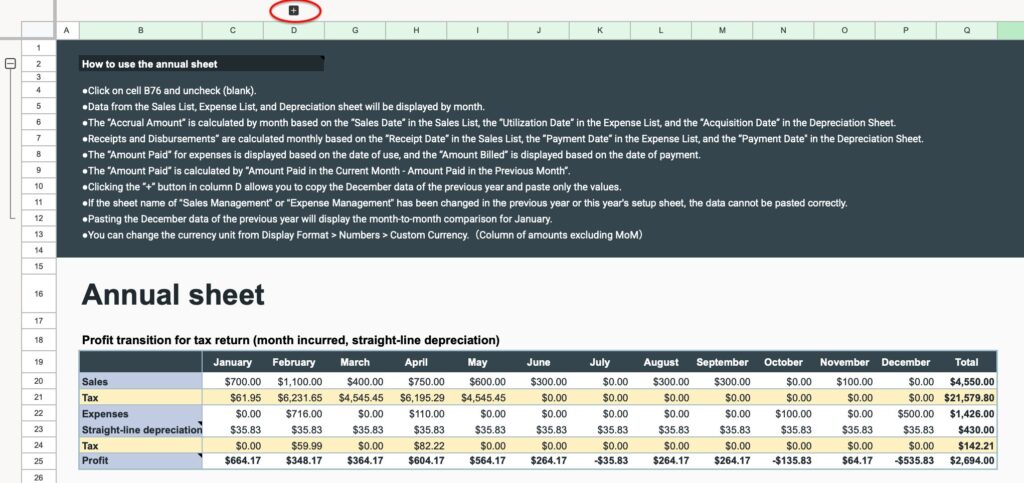
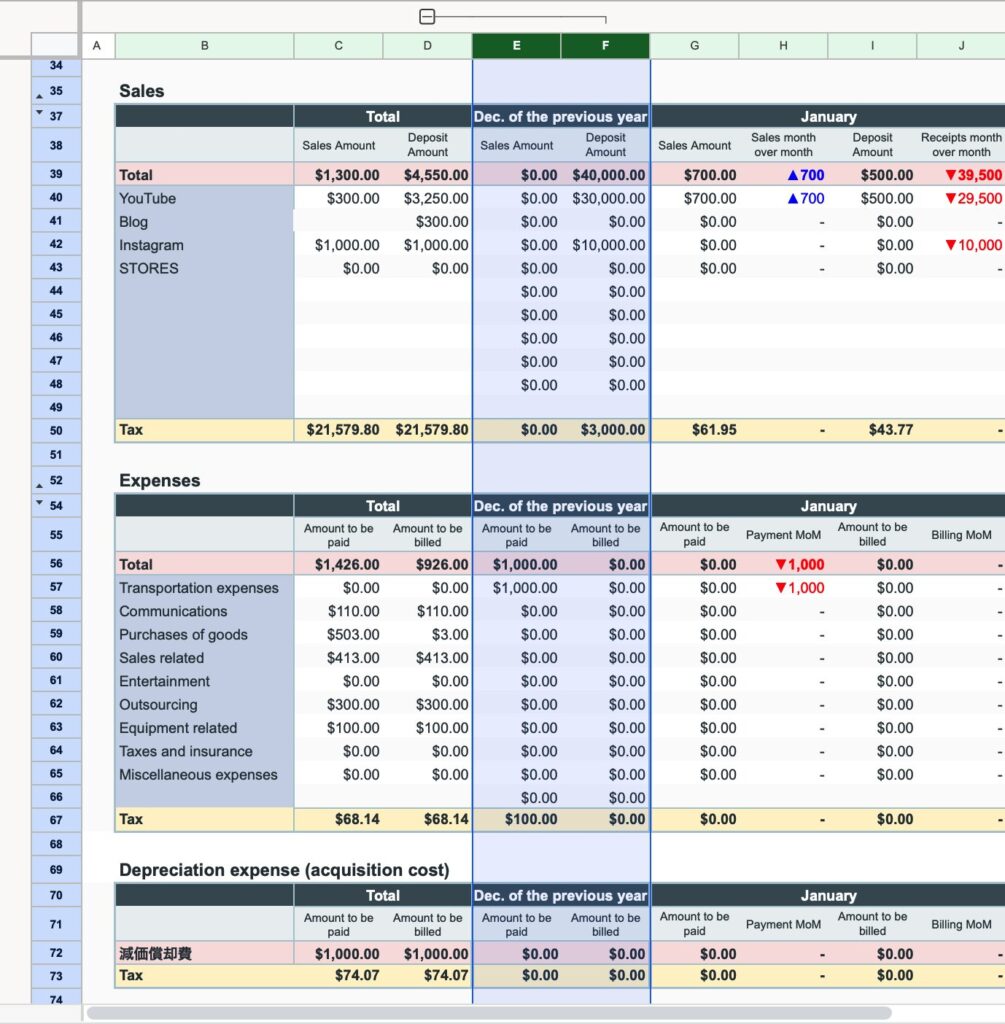
The column for December of the previous year will be displayed.
Copy the December column from the annual sheet of the previous year's “Sales Management Template” and paste only the values into the EF column.
If the major category names or minor category names have been changed, or if the template format has been modified, it may not be possible to use it normally.
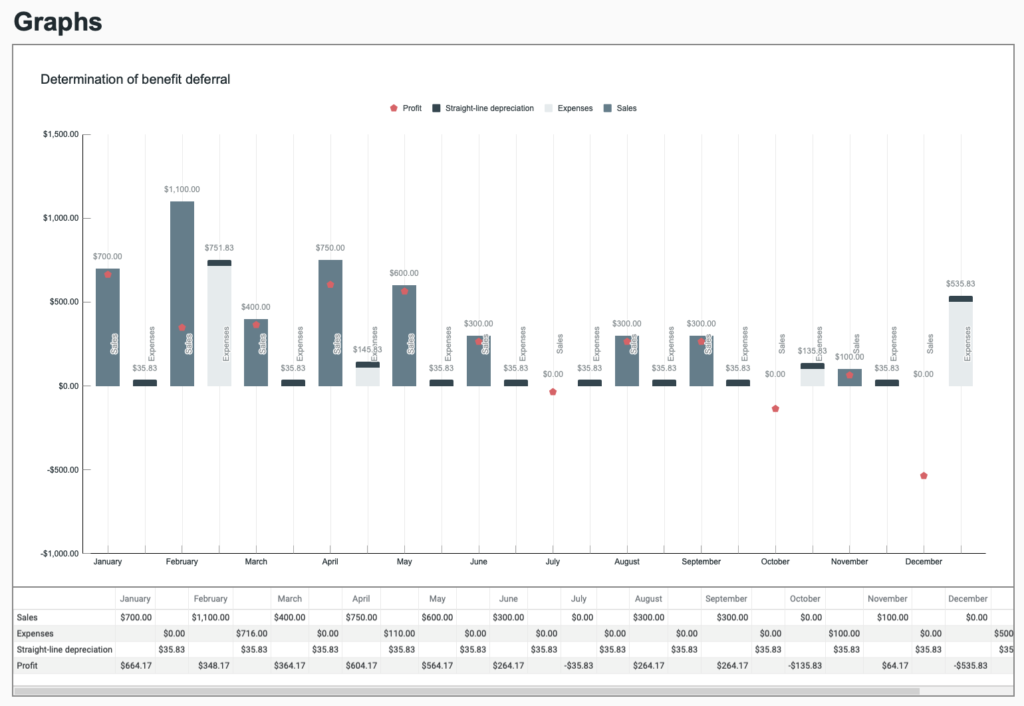
Graph sheet
The graph shows the monthly changes in annual seats.
Sales are shown as bar graphs, expenses and fixed depreciation expenses are shown as stacked bar graphs, and profits are shown as stars.
Graph display items
- Profit trends for tax returns
- Profit trends by month of occurrence
- Profit trends by month of deposit/withdrawal
- Sales trends by month of occurrence
- Sales trends by month of deposit
- Expense trends by month of occurrence
- Expense trends by month of withdrawal
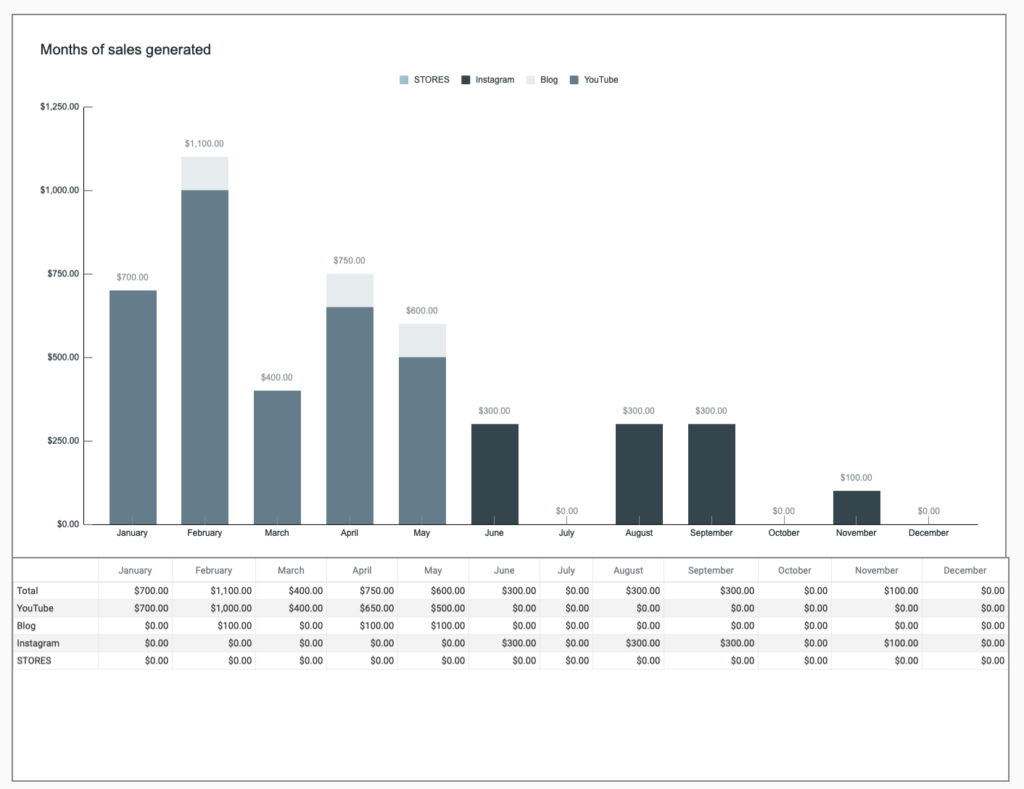
Goal sheet
The target sheet sets monthly sales targets and displays the achievement rate against actual results.
Annual sales targets and achievement rates
Enter the annual sales targets for each major category.
The sales amount, amount to achieve the target, and achievement rate are displayed.
Expense targets are entered by setting monthly target amounts.
Profit target = total sales target - total expense target
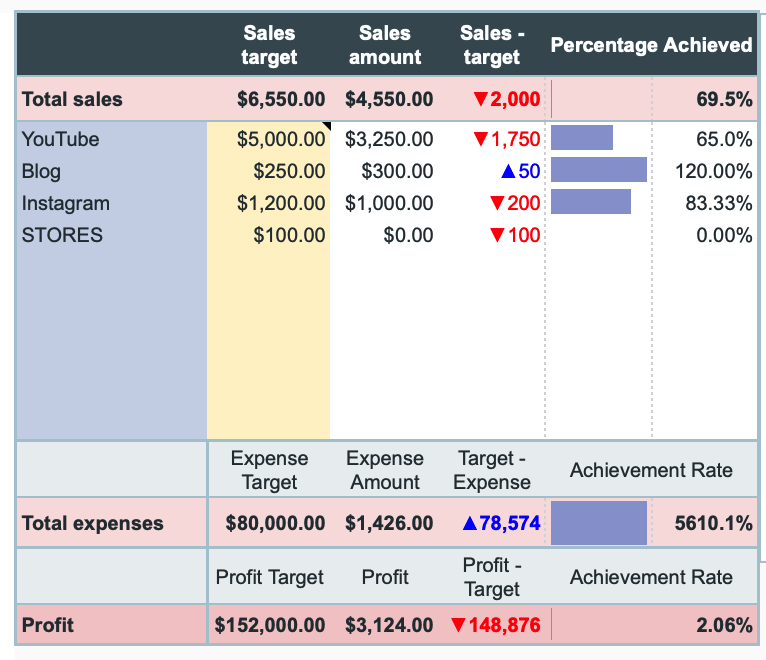
Target sales and sales amount graph
Compare target sales and actual sales by major category using a stacked bar graph.
Profit target and profit graph
Compare profit targets and profits using a bar graph.
Amount graph until achievement
Display sales amounts and remaining amounts until targets are achieved, as well as profits and amounts until profit targets are achieved, using a bar graph.

Sales targets by subcategory
Click on the filter in cell B50 and uncheck “Blank.”
Blank rows will be hidden.
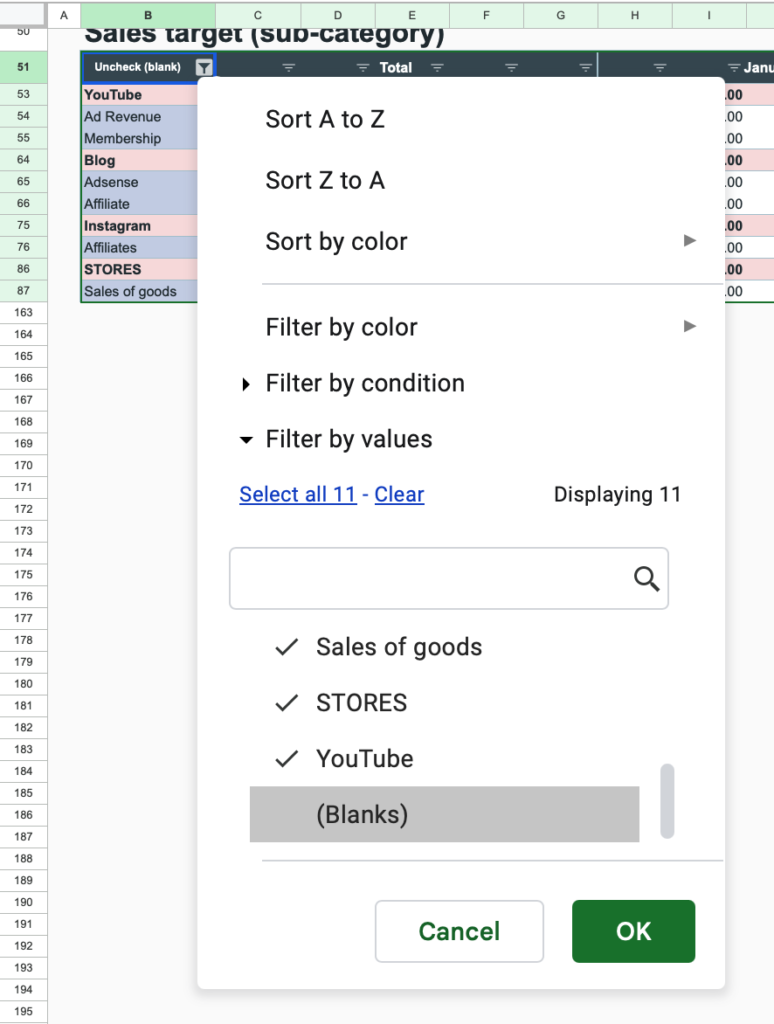
Enter sales targets for each subcategory. (Yellow background color)
The achievement rate for each subcategory is displayed in a bar graph.

Sales targets by major category
The target amounts entered in the minor categories will be reflected.
Please enter your monthly expense targets (yellow background color).

Account sheet
The sales list shows the deposit account and the expense list shows the withdrawal account amounts by month.
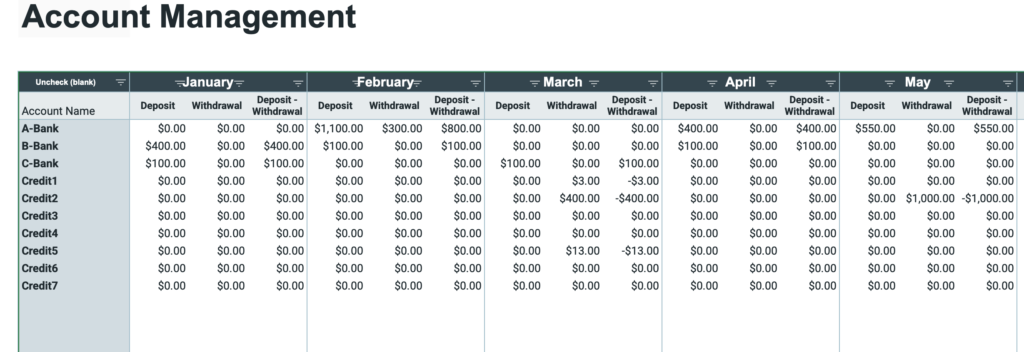
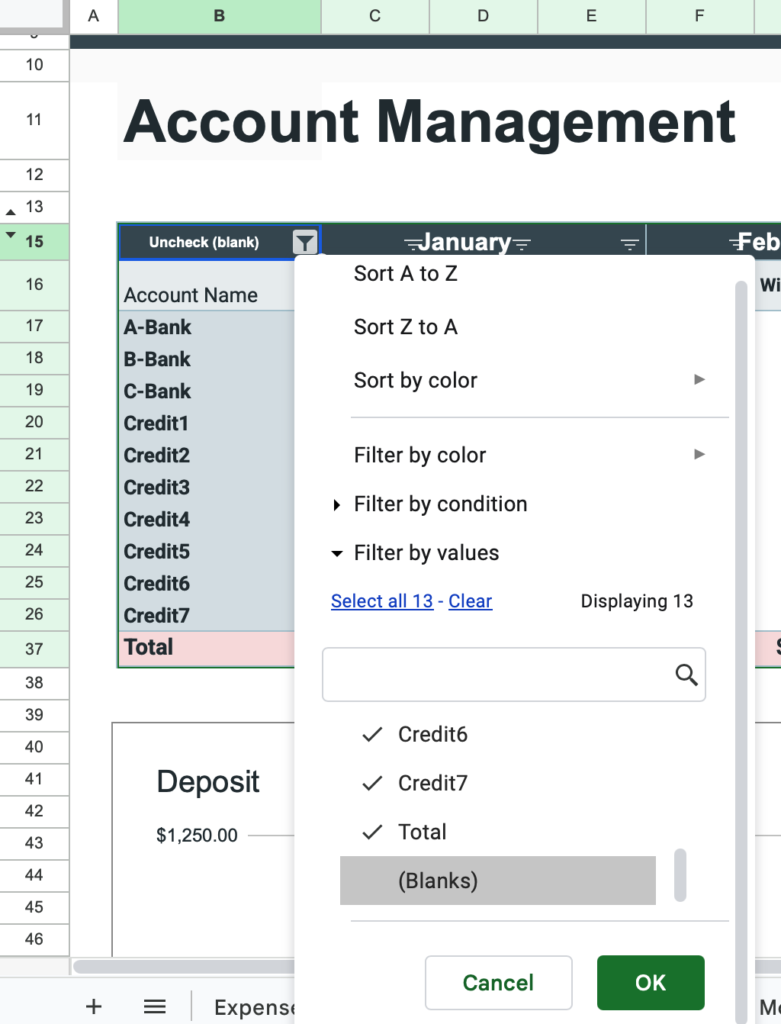
Click on the filter in cell B15 and uncheck “Blank.”
Blank rows will be hidden.
Display graphs showing annual trends in deposit amounts, withdrawal amounts, and deposit-withdrawal amounts.
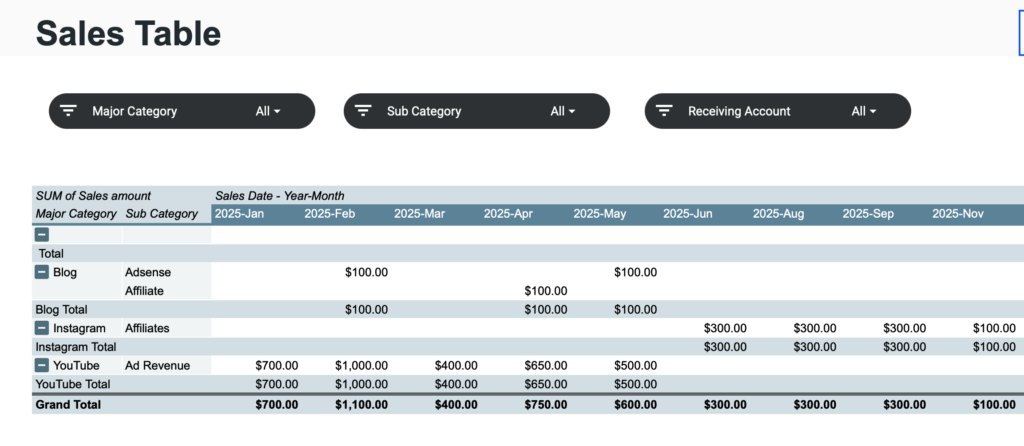
Sales table
Sales data is displayed by sales and category based on the sales list.
The slicer function allows you to display only specific items.
Sales are displayed by month based on the sales date.
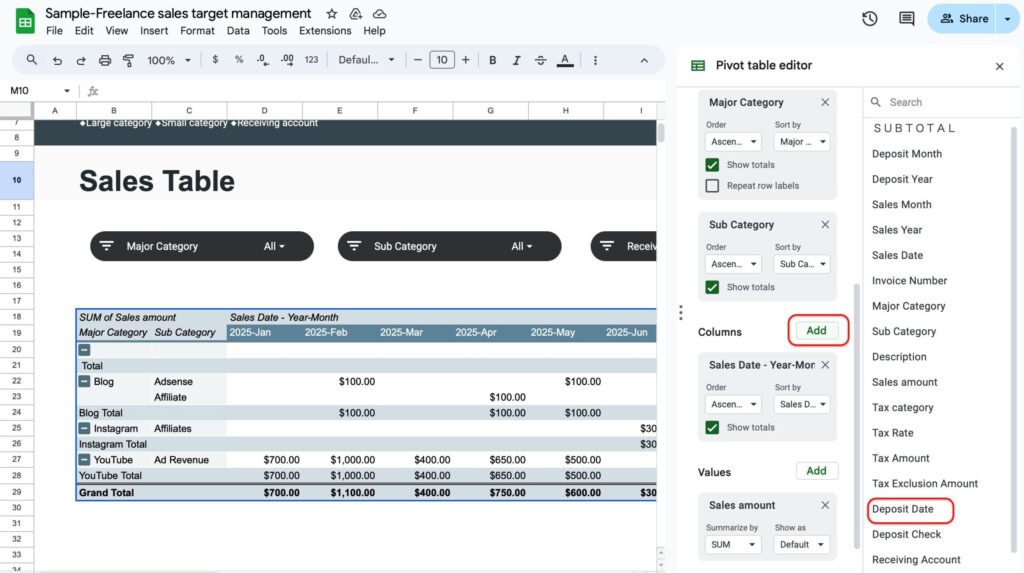
If you want to align with the payment date, click the “Edit” button below the table.
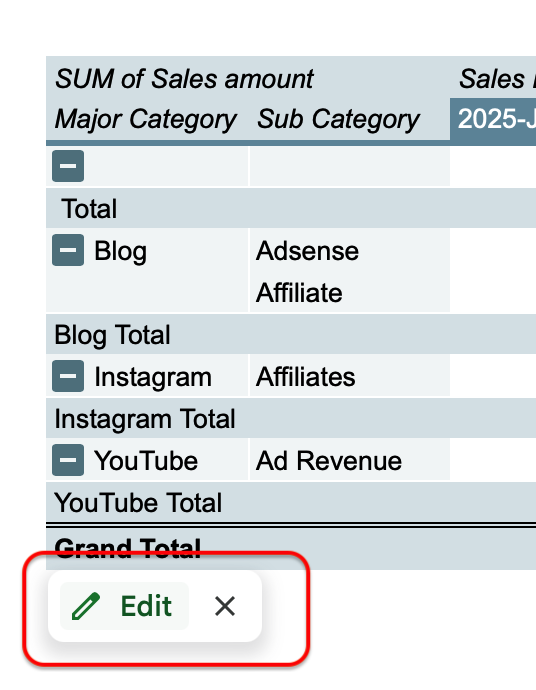
Click the “Add” button in the column and select “Deposit Date.”
Delete the “Sales Date” displayed in the column by clicking the “X” in the upper right corner.
Expense table
Expense amounts are displayed by category based on the data in the expense list.
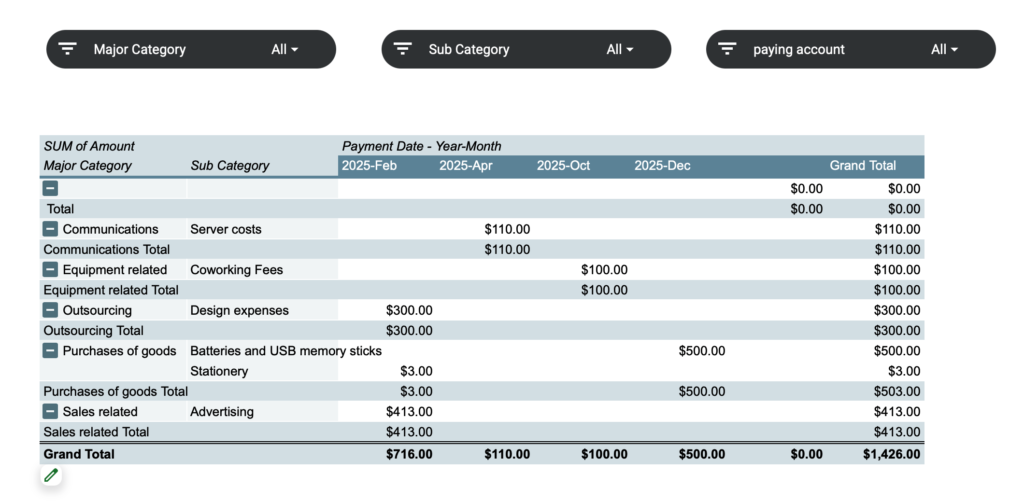
As with the sales list, you can use the slicer to display only specific items.
The display is based on the date of use, but if you want to change it to the payment date, add the payment date to the column from the edit button. (Refer to the sales table.)
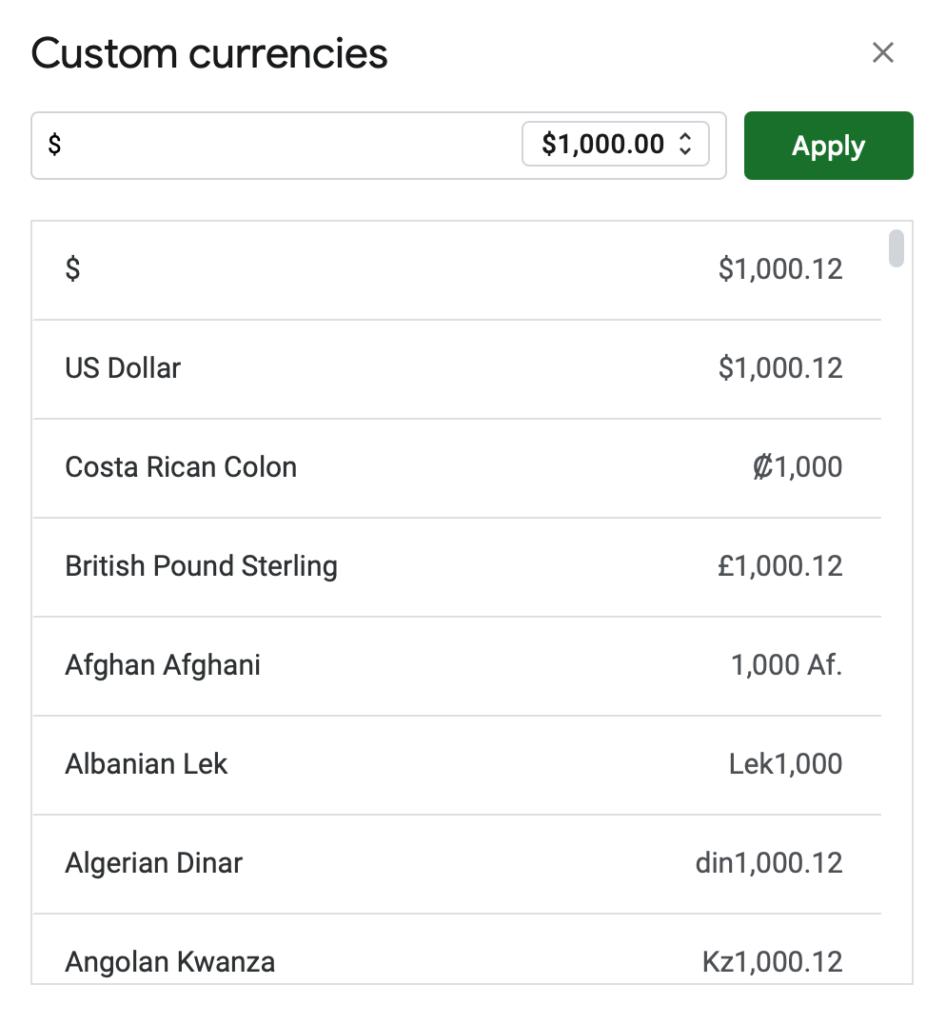
How to change currency units
The default currency unit is the dollar.
The top of the sheet shows the range in which the currency unit is to be changed.
Click on the range listed to change the unit of measure.
Click on Format,Number,Currency.
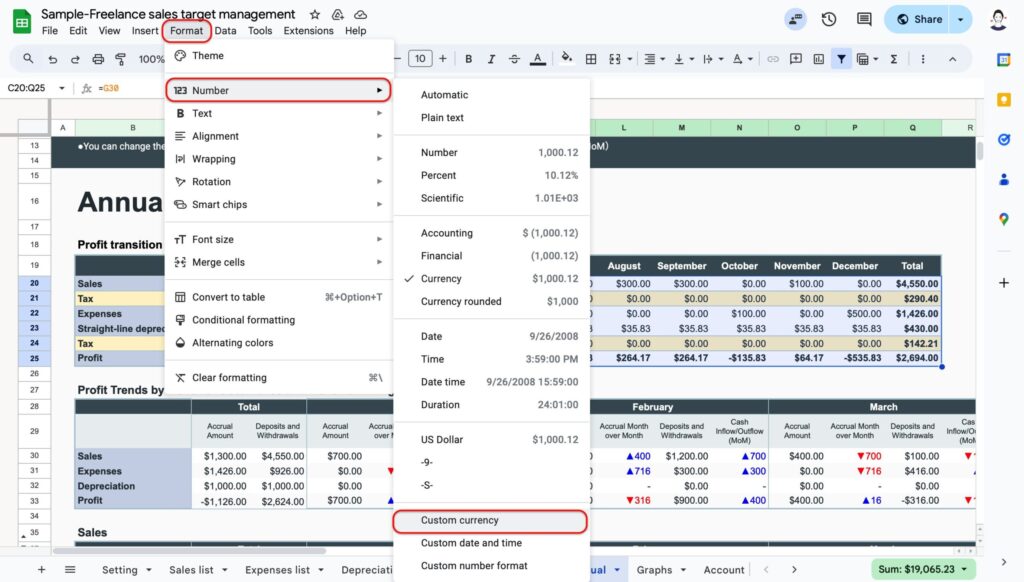
Select the currency unit for your country and click ”Apply".
Do all of this work for each sheet.
Download
This sales template is available for purchase on STORES.
Click the download button to go to the STORES purchase page.
Store Name: Kakeibo Life
Price:3500JPY
