Keeping a household budget doesn't stick.
I can't compare it to the previous year.
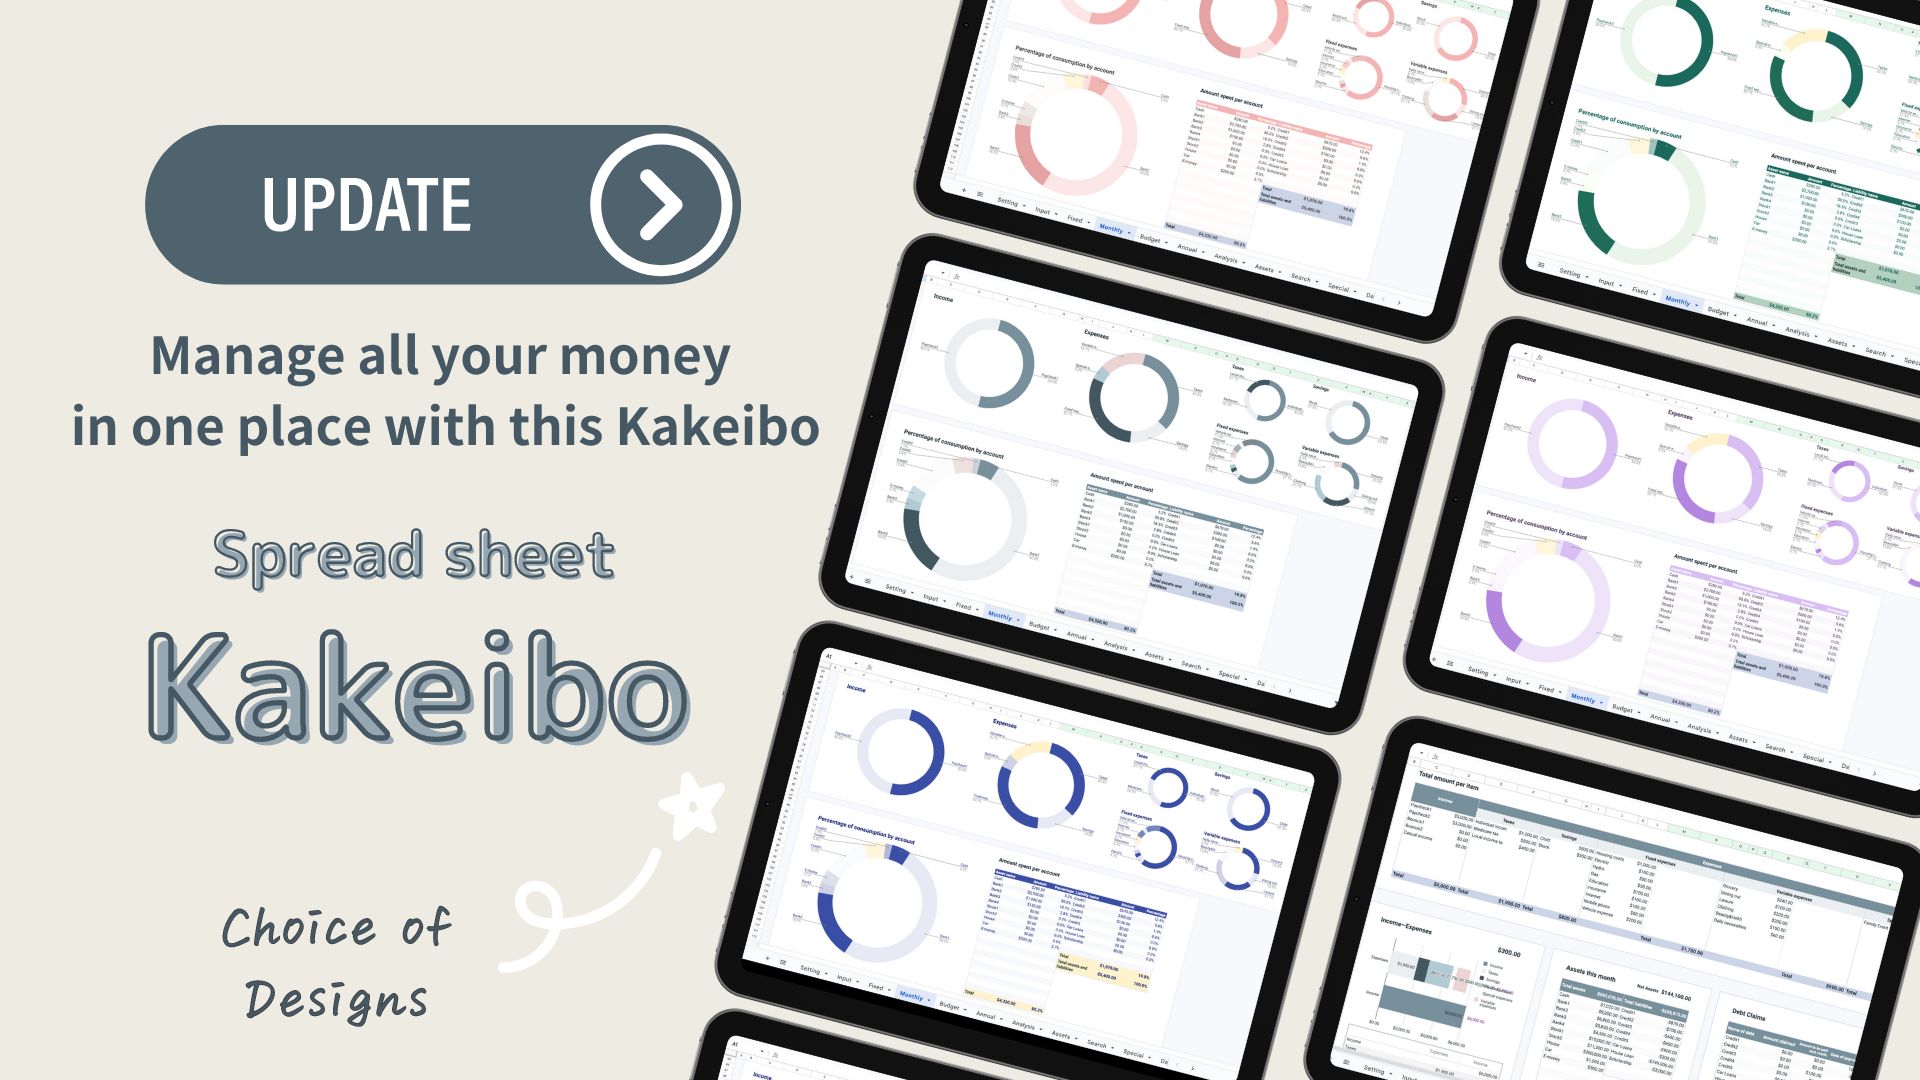
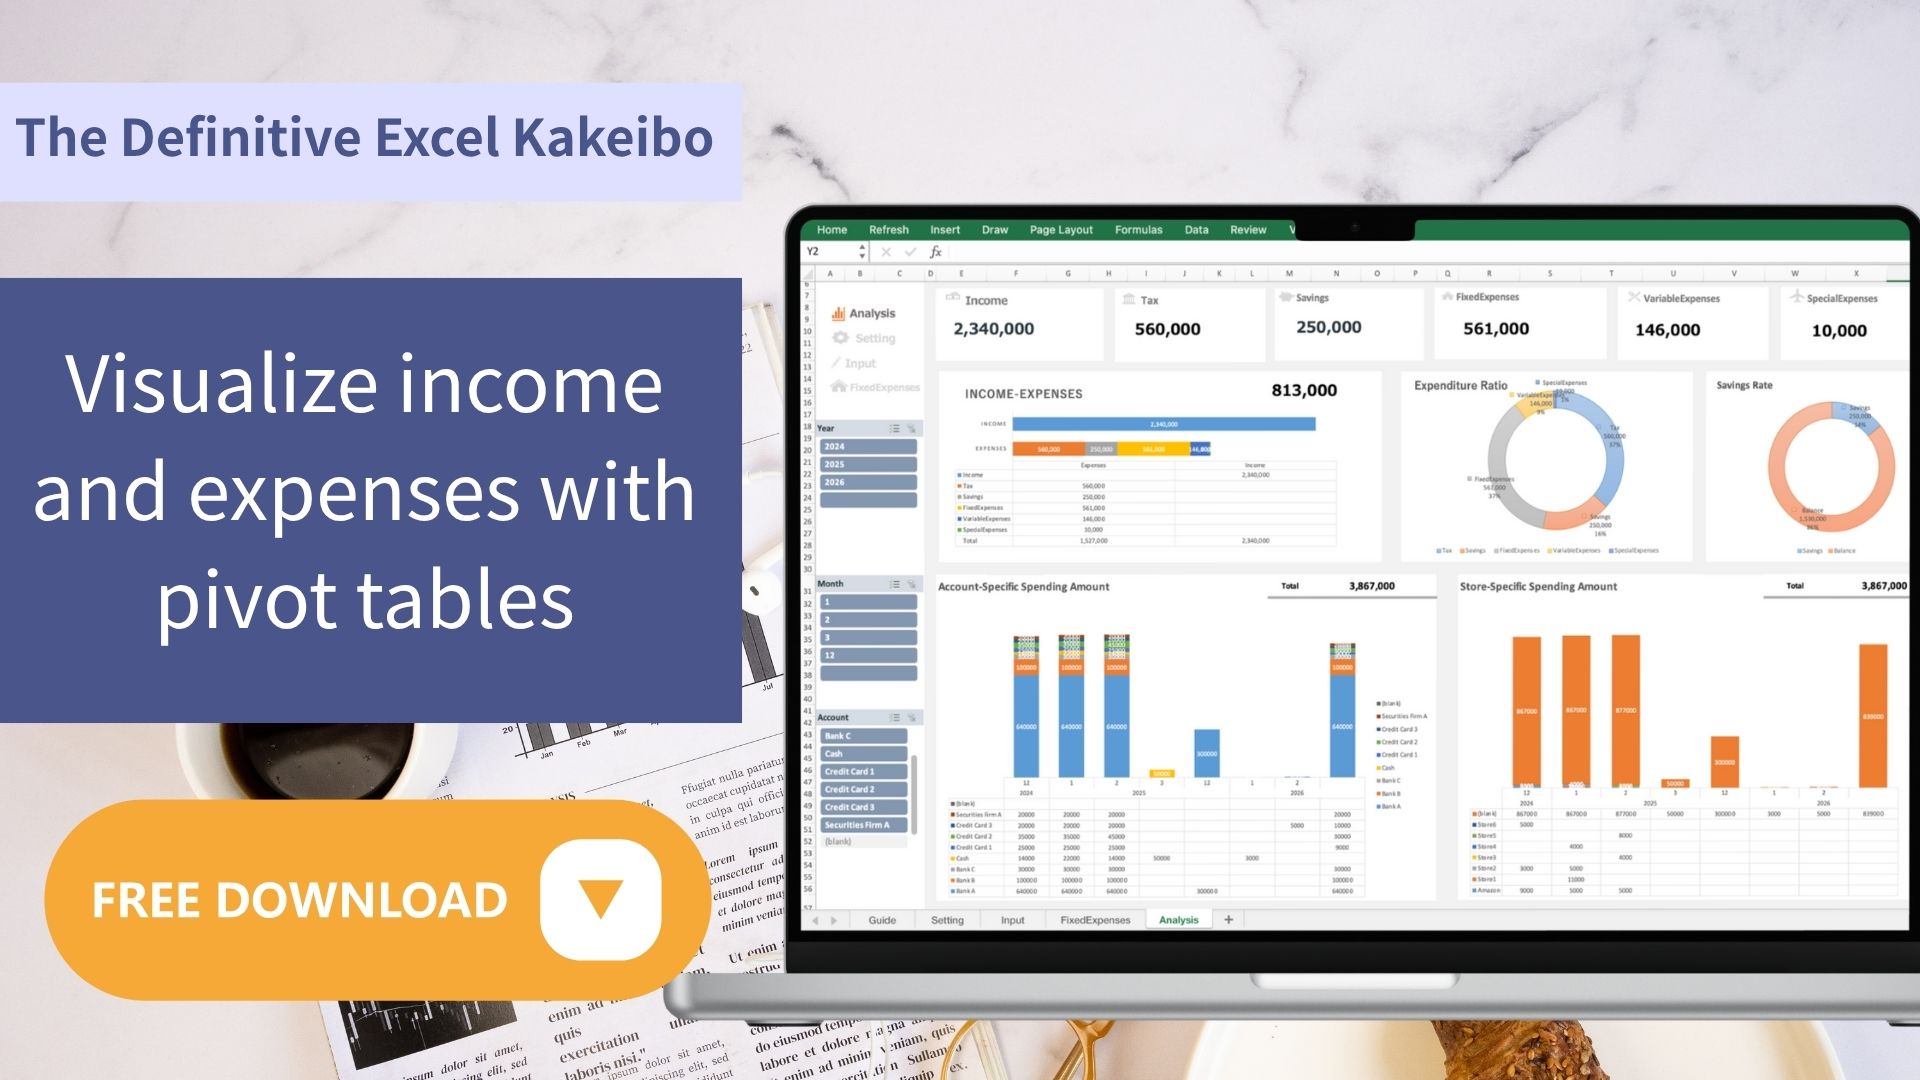
Solve those headaches with an Excel household budget that analyzes data using pivot tables.
Simply enter your data, then switch between yearly comparisons and monthly trends with a single button.
The Excel household budget I'm introducing isn't just a recording tool—
it's the definitive household budget solution, featuring automatic analysis and visualization via pivot tables.
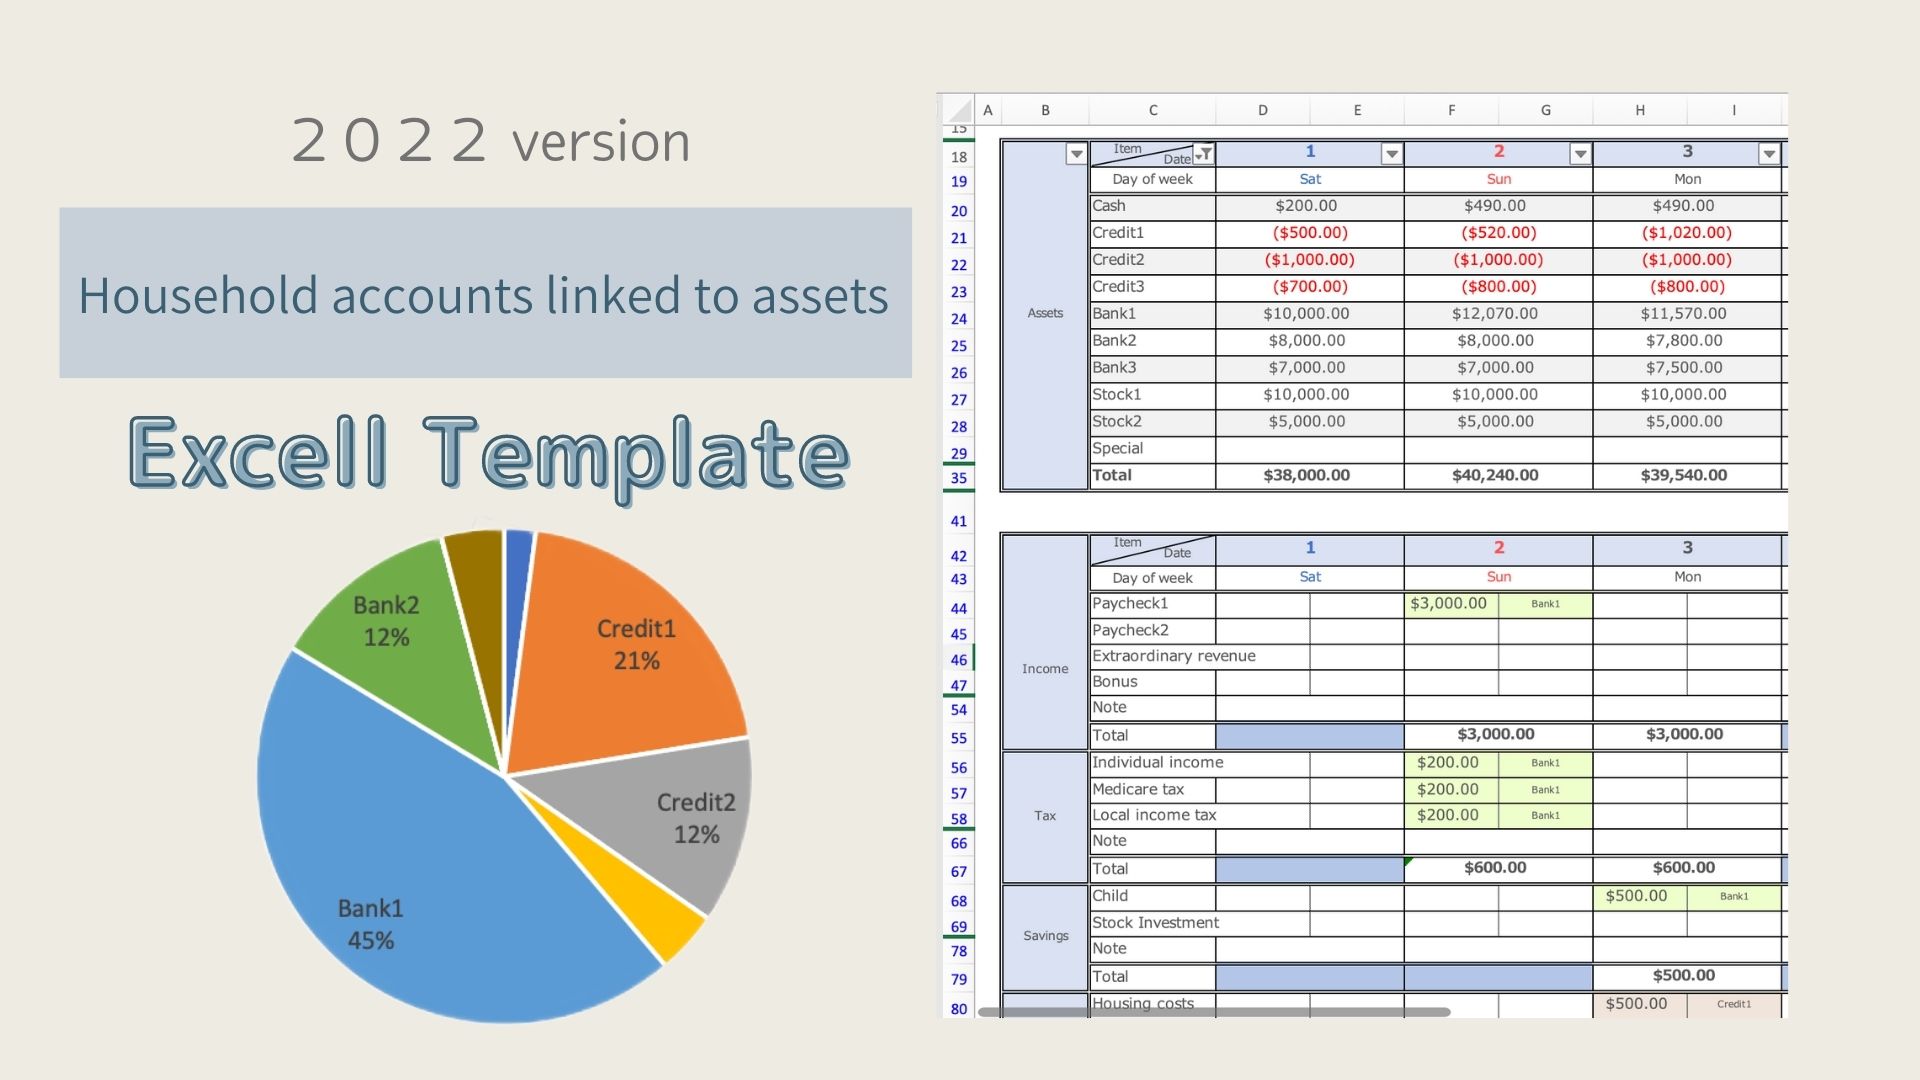
It consolidates your household ledger, account spending, and graph analysis all in one place,
equipped with a system that not only makes your income and expenditure flow “visible” but also “understandable.”
Key Features of This Budget template
Free household budget template compatible with Microsoft Excel.
The definitive Excel household budget tool that automates everything from input and aggregation to analysis and graphing.
| Features | Details |
|---|---|
| Auto-Aggregation | Input data automatically reflected in pivot tables |
| Visualization | Display spending and account consumption trends with graphs |
| Year/Month Switch | Switch periods with a single click |
| Unlimited Expense Categories | Unlimited registrations for accounts, store names, and expense categories for analysis |
| Free Download | Templates freely usable for personal use |
Unlimited expense categories for analysis
Using the table function allows you to register an unlimited number of accounts, expense categories, and store names.
Recommended for those who want detailed analysis.
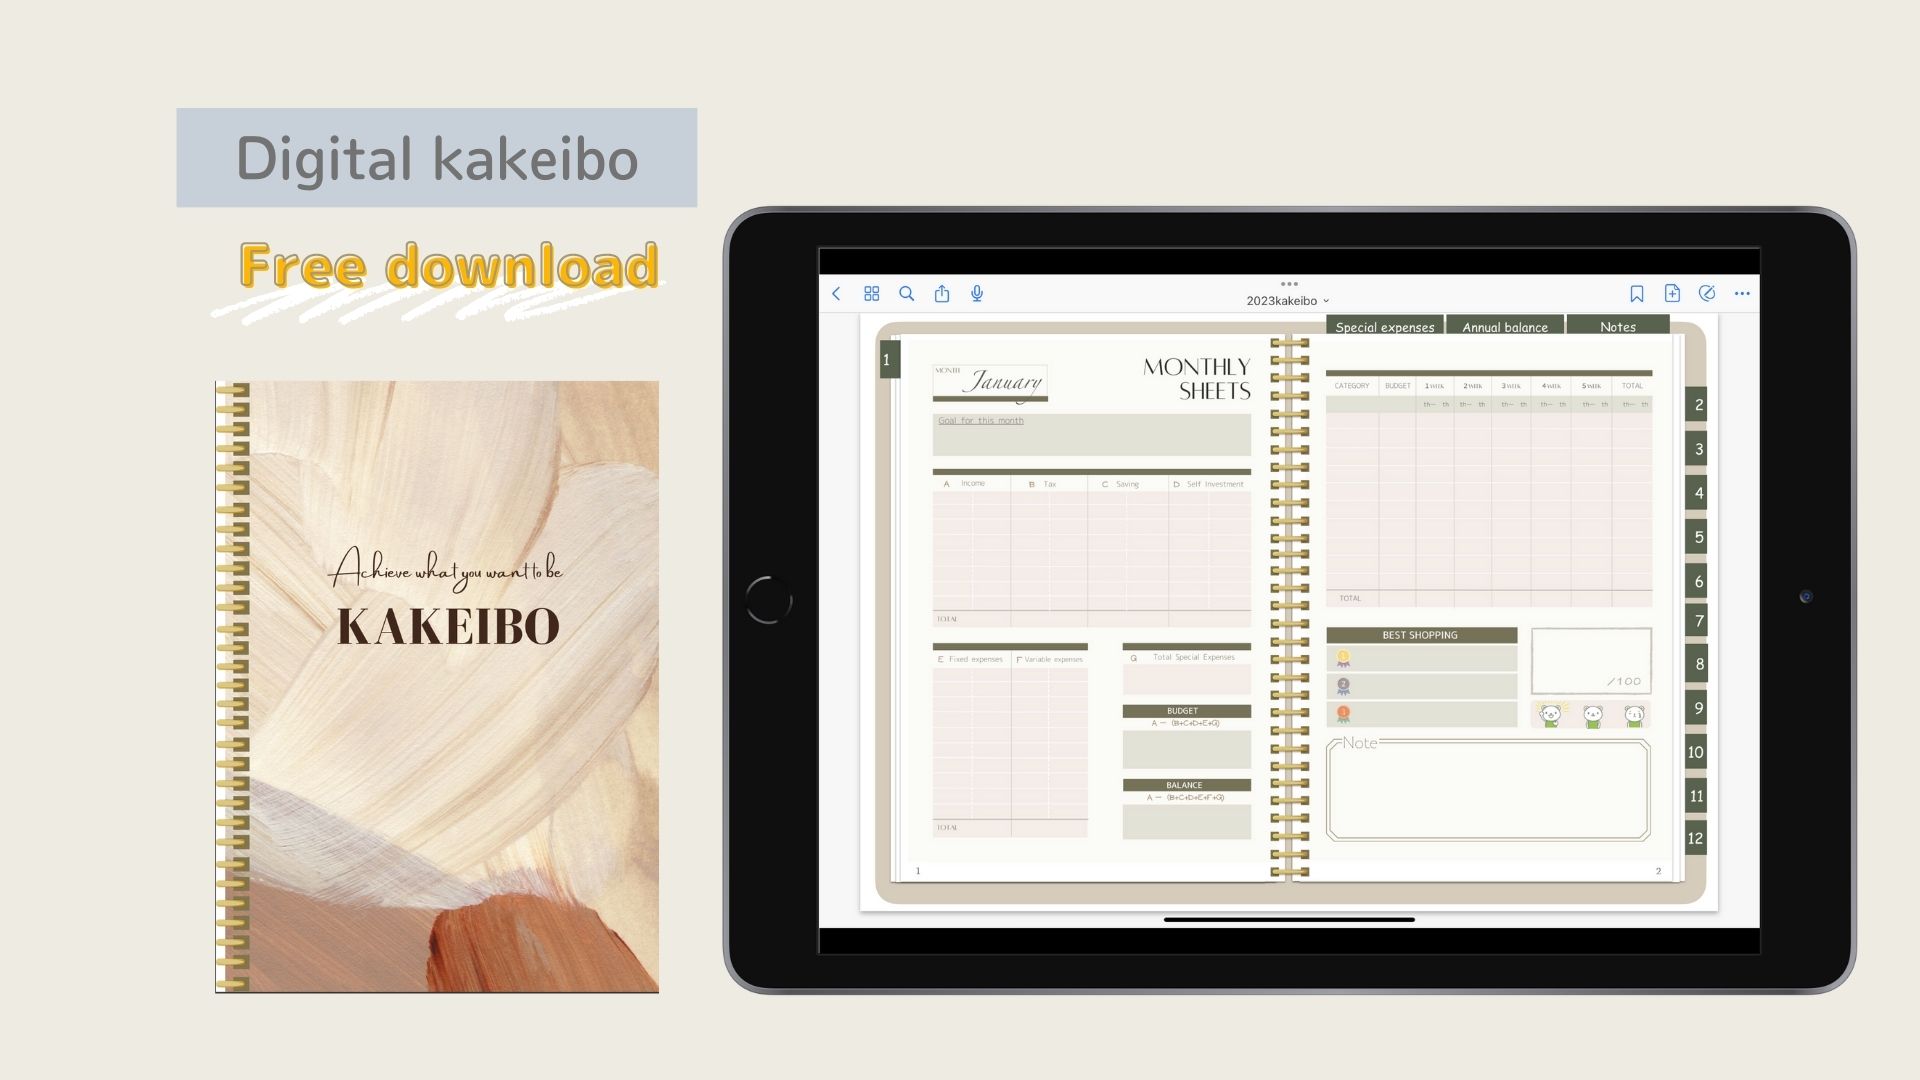
Simple input for easy maintenance
A design requiring only date, item, and amount input.
No complex functions or macros needed, making it easy for beginners.
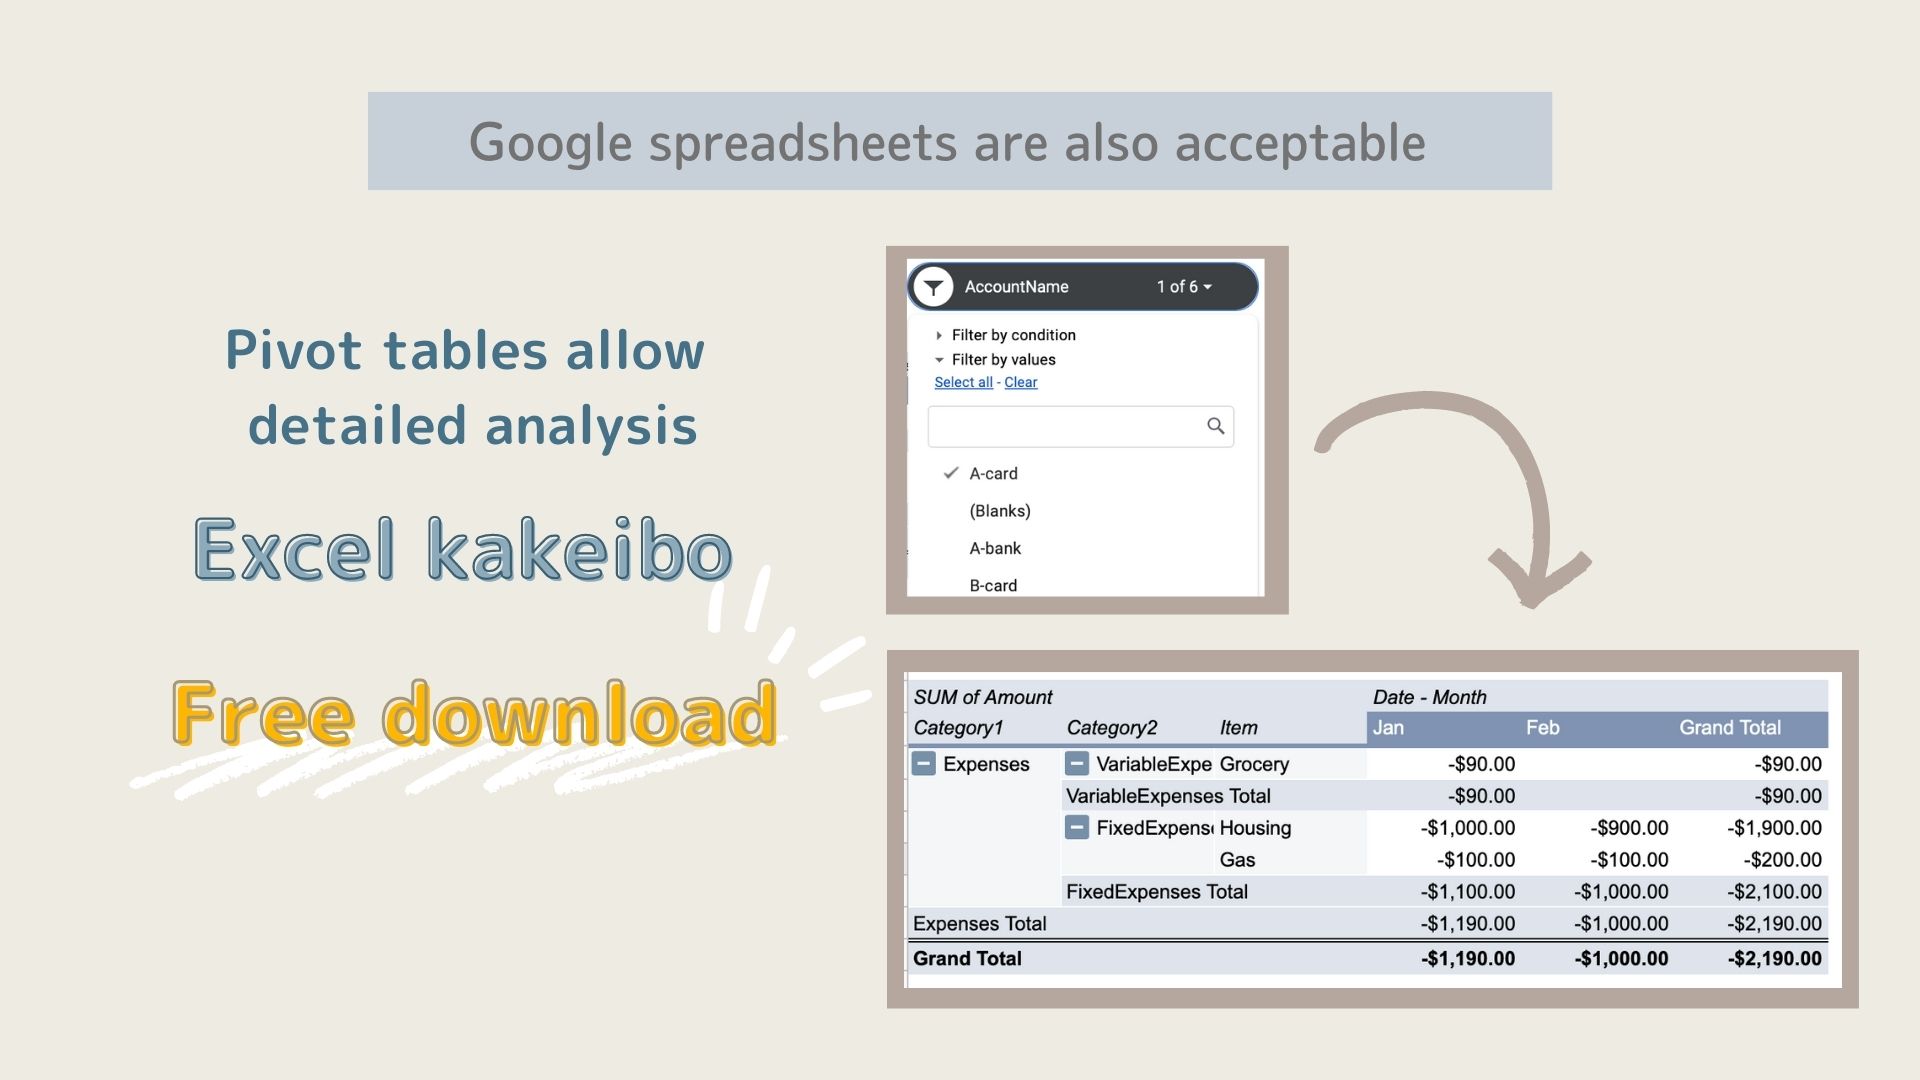
Detailed analysis via analysis sheets
Based on daily records, automatically aggregate monthly spending trends and expense category proportions using pivot tables.
Analyze income and expenses for selected years and months using slicers.
Sheet Structure and Function Overview
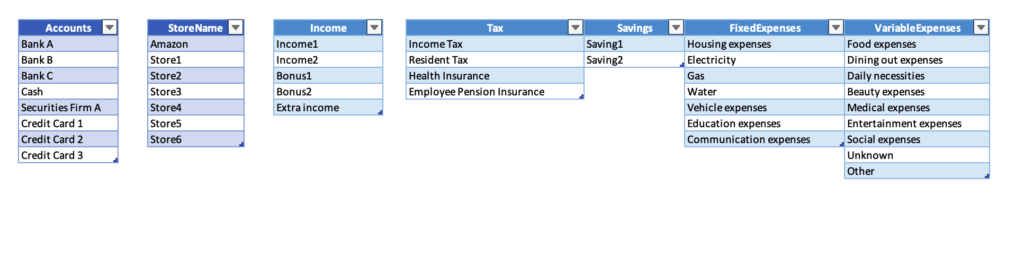
【1】Settings Sheet – Basic configurations like expense categories, accounts, and periods
The first sheet you'll use is the “Settings” sheet.
Registering basic information here, such as “Account Name” and “Expense Category,” will reflect in the Input Sheet and Analysis Sheet.
Main Settings Items
- Account Name (Bank, E-money, Cash, etc.)
- Store Name
- Expense Category Classification (Income, Taxes, Savings, Fixed Expenses, Variable Expenses)
There is no limit to the number of entries.
A new field is automatically added each time you enter data.
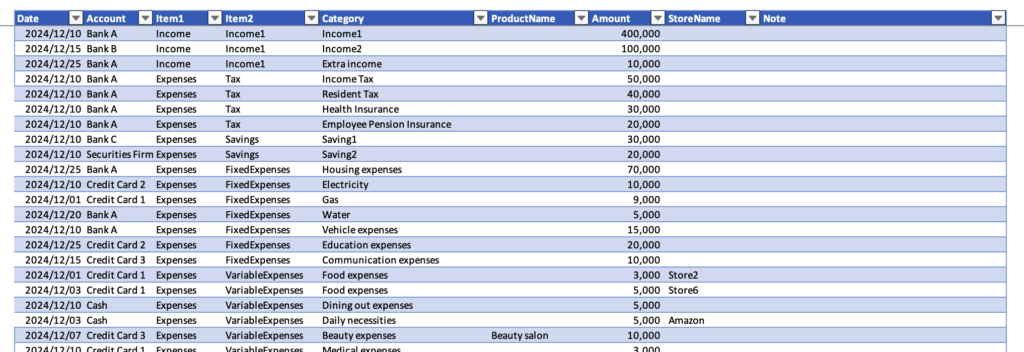
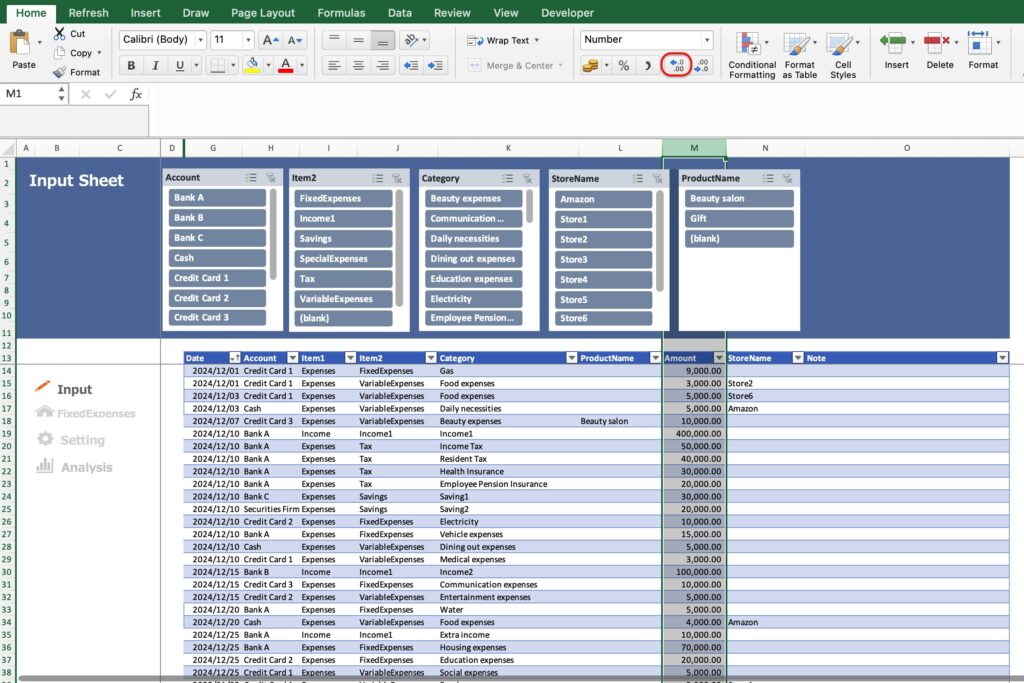
【2】Input Sheet – Main sheet for recording daily income and expenses
This is the main sheet for recording daily expenses and income.
Enter the date, category, income/expense type, and amount, and it will automatically update the summary data.
Input Fields
- Date: Enter the year, month, and day. (Example: January 1, 2025 ➡ 25/1/1)
- Account: Select from the tabs.
- Category 1: Select income or expense from the tabs.
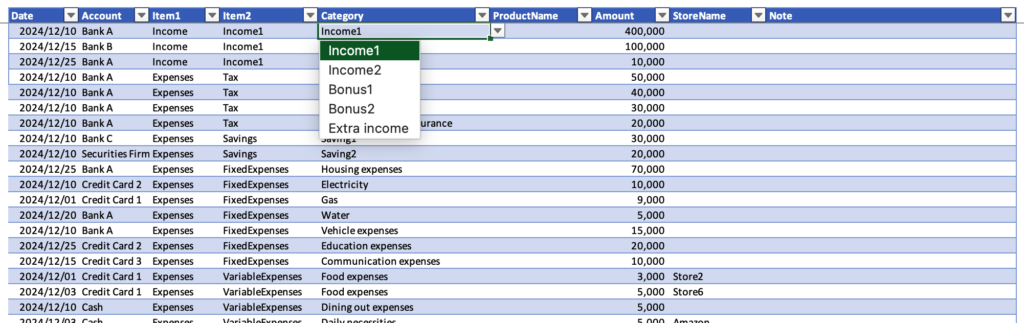
- Item 2: If Item 1 is income, select “Income 1”. If it is an expense, select from “Taxes”, ‘Savings’, “Fixed Expenses”, “Variable Expenses”, or “Special Expenses”.
- Category: The category name selected in Item 2 will appear in the tab. Select the category name from the tab.
- Item Name: Enter the item name manually if applicable.
- Amount: Enter the amount manually.
- Store Name: Select from the tab.
Input data is automatically aggregated in the “Analysis Sheet” and reflected in the graph.
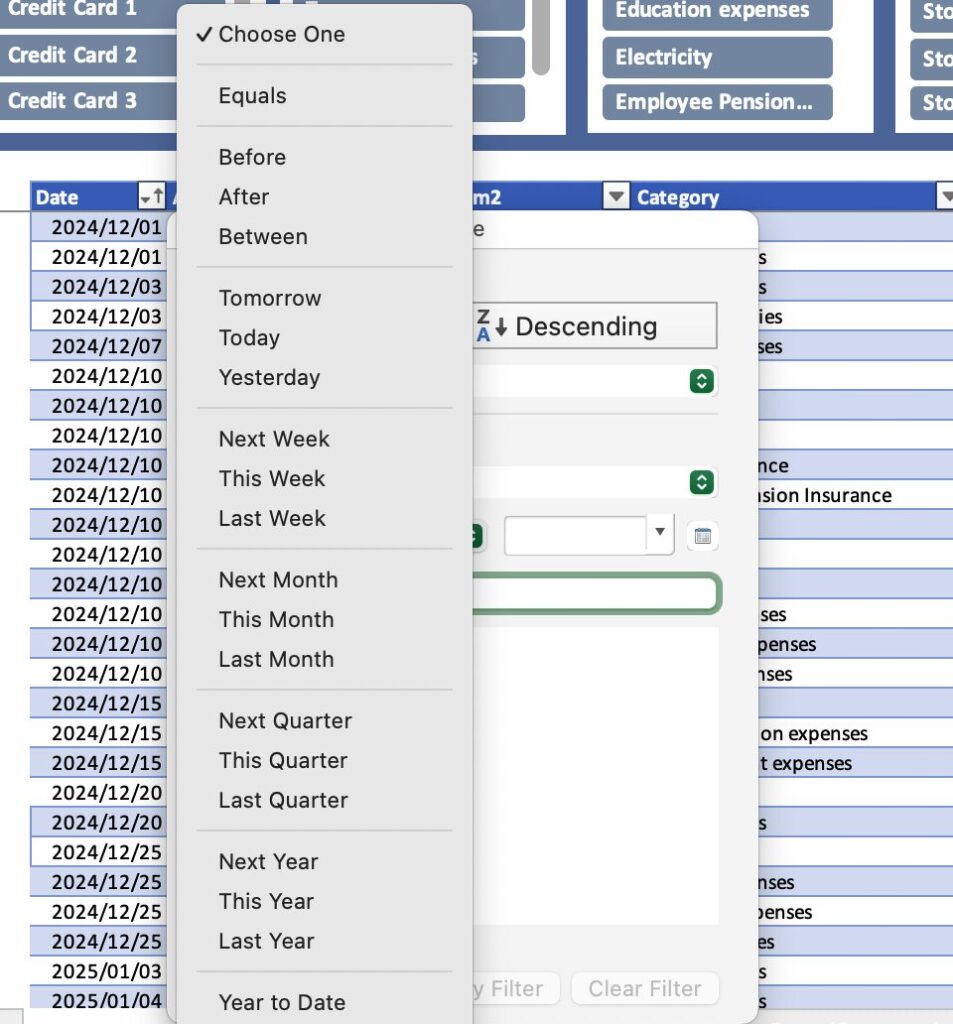
To sort by date, click the date filter and select “Ascending” for the sort order.
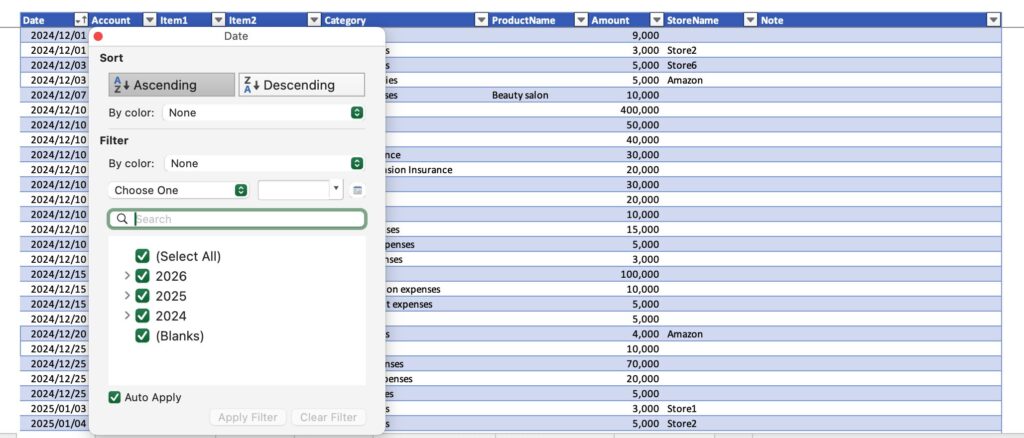
You can also display only specific periods using the date filter.
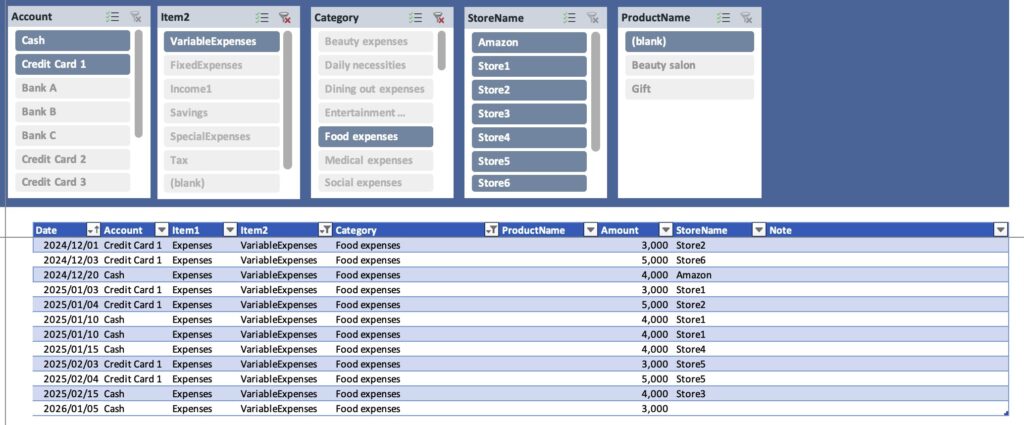
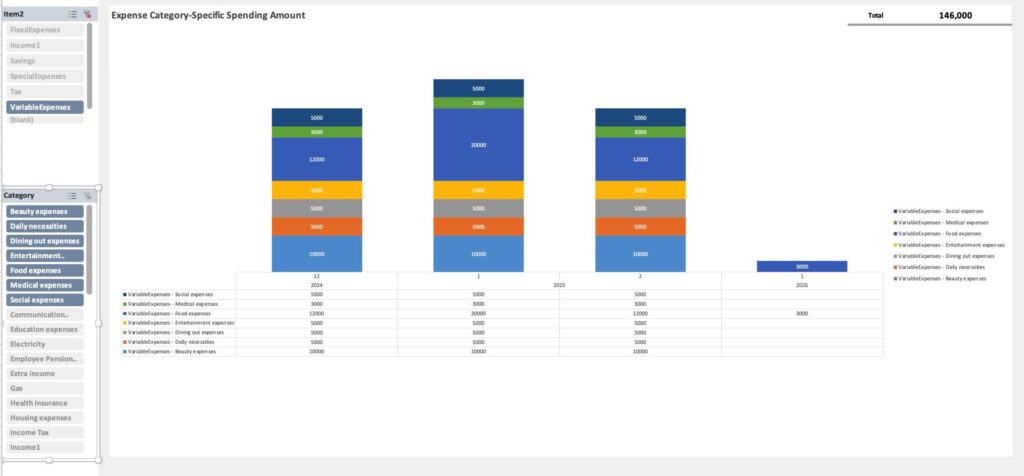
Using the slicer feature, you can display only specific items.
For example, to display food expenses, select Item 2 “Variable Expenses” and the expense category “Food Expenses”.
To reset, click the ✖️ icon in the upper-right corner of the slicer.
To add decimal places to an amount, use the decimal point arrow icon on the home screen.
【3】Fixed Expenses Sheet – Manage monthly fixed expense lists
Manage recurring monthly expenses like rent, insurance, communication fees, and subscriptions all in one place.
Set it up once to drastically reduce time spent entering monthly household accounts.
It uses the same table format as the input sheet.
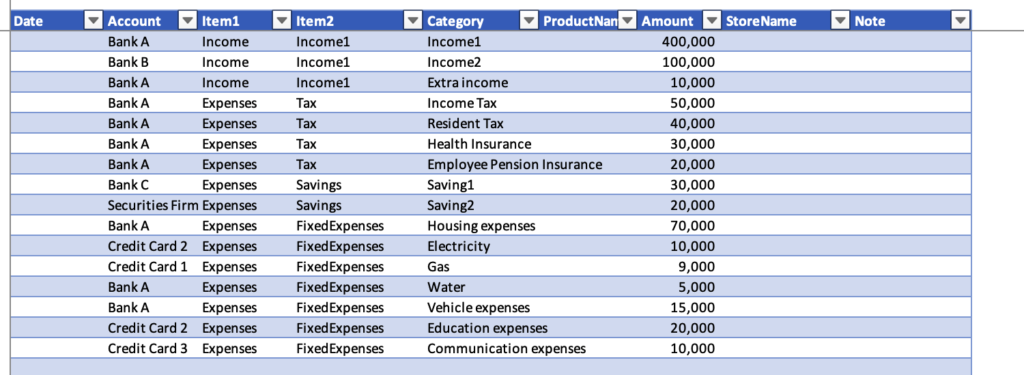
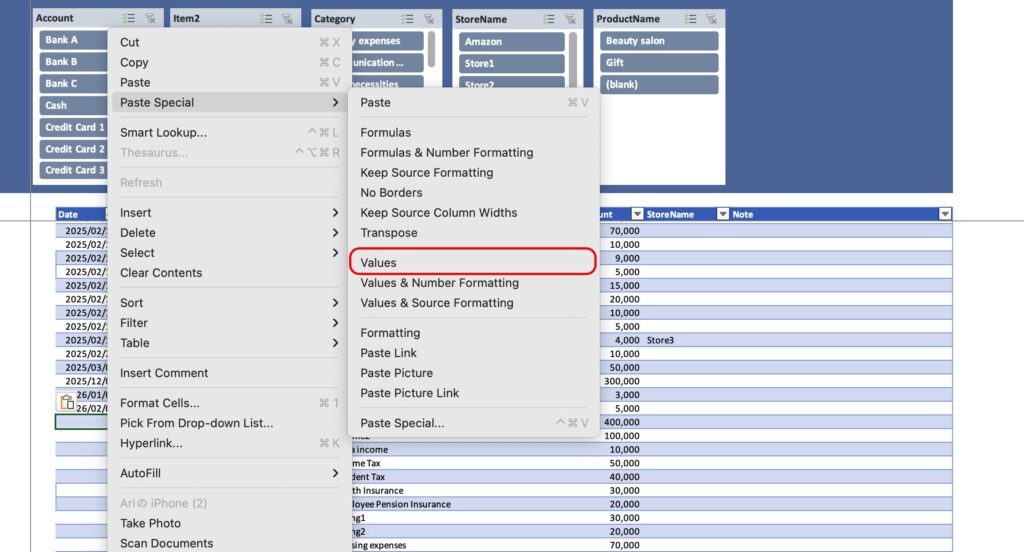
Please paste the values into the input sheet at the start of each month.
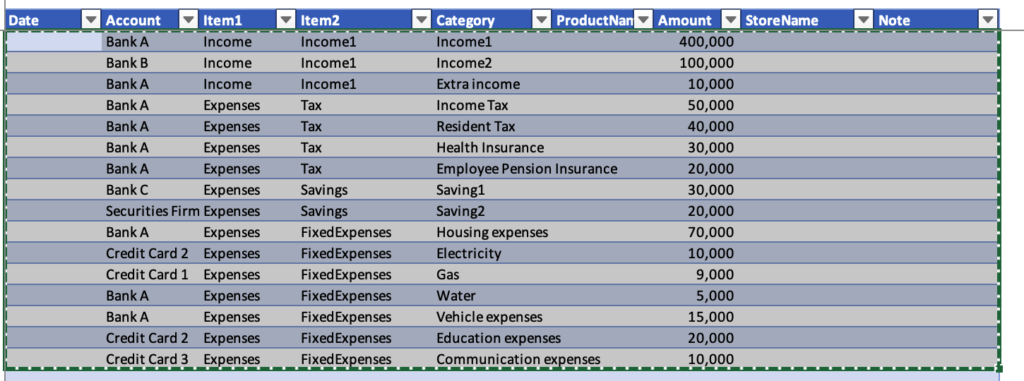
After pasting the values, enter the date and make corrections if there are any changes to the amounts.
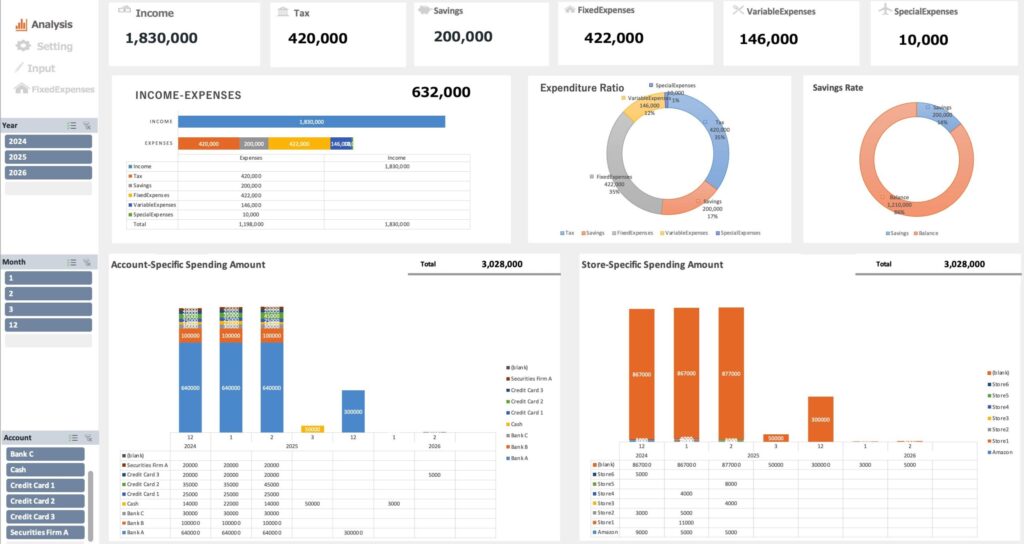
【4】Analysis Sheet – Visualize household finances with pivot tables
The contents of the input sheet will be reflected in the analysis sheet.
Since automatic updates are not enabled, please manually update the analysis sheet each time you make an entry in the input sheet.
How to Update
Click any pivot chart (Account-Specific Spending Amount, Store-Specific Spending Amount, Expense Category-Specific Spending Amount), then click “Refresh All” under “Refresh”.
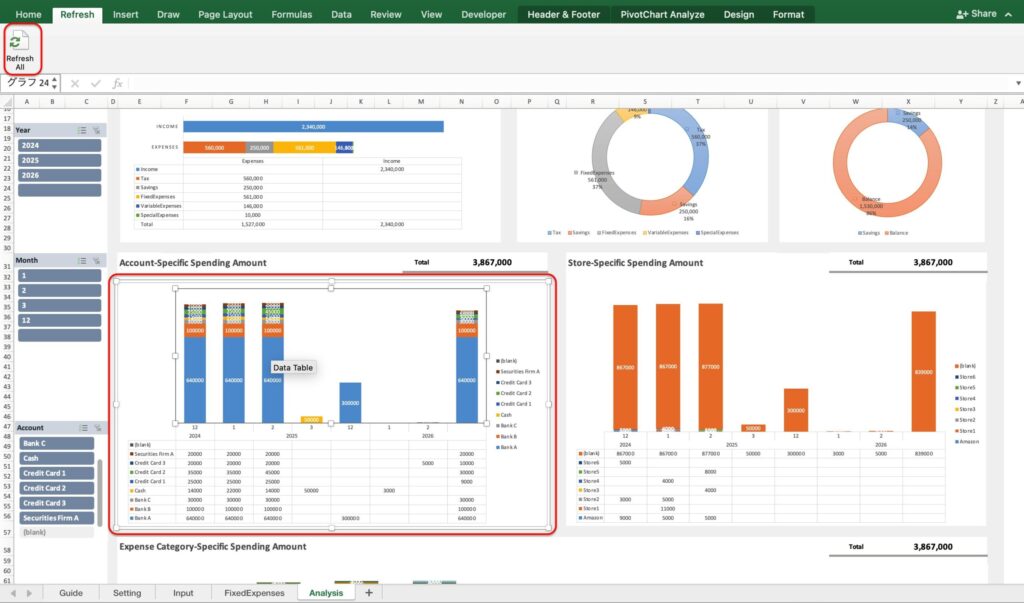
Click the period (year, month) and items you wish to display in the ABC column slicer.
The analysis results for the selected period and items will be displayed.
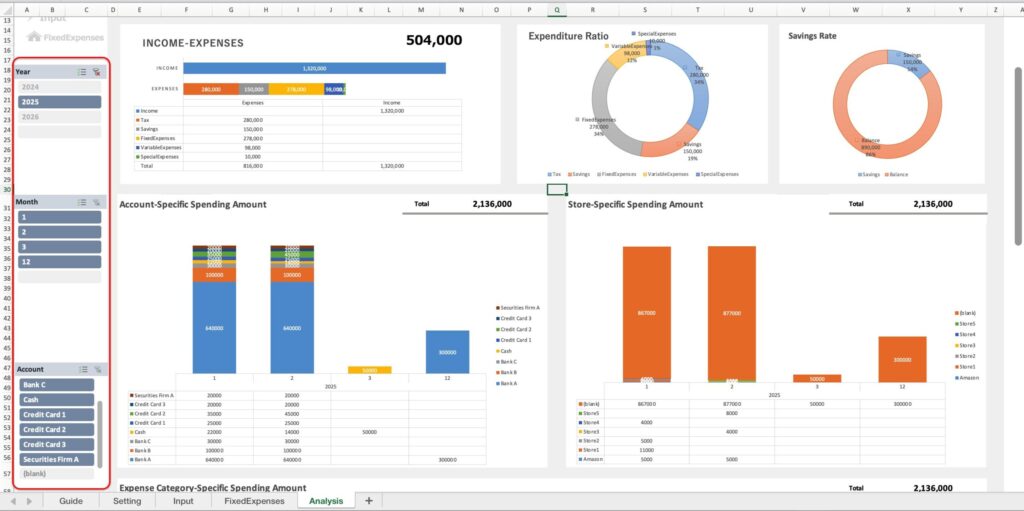
Item Category
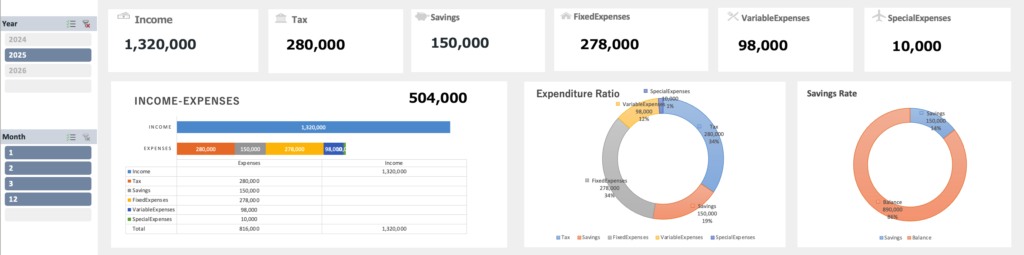
- Total Amount by Expense Category
- Revenue - Expenditure
- Expenditure Ratio
- Savings Rate
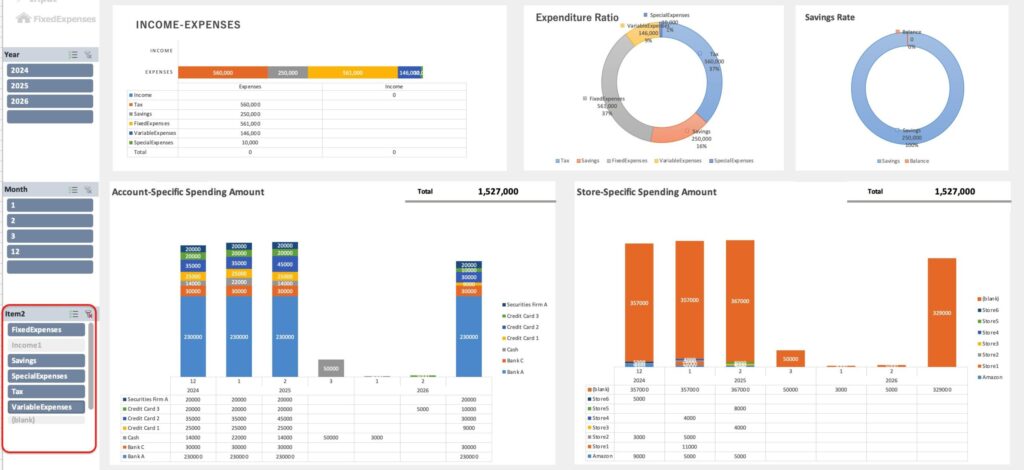
- Consumption Amount by Account
- Consumption Amount by Store Name
- Consumption Amount by Expense Category
The account-specific spending amount includes the account selected for income.
Please select items other than income in the slicer to display the spending amount.
Select while holding down the Ctrl button. (Command button on Mac)
Please select the items you wish to display in the slicer.
Free Download
Please select the items you wish to display in the slicer.
※Compatible with Excel 2016 and later
※Commercial use and redistribution are prohibited.