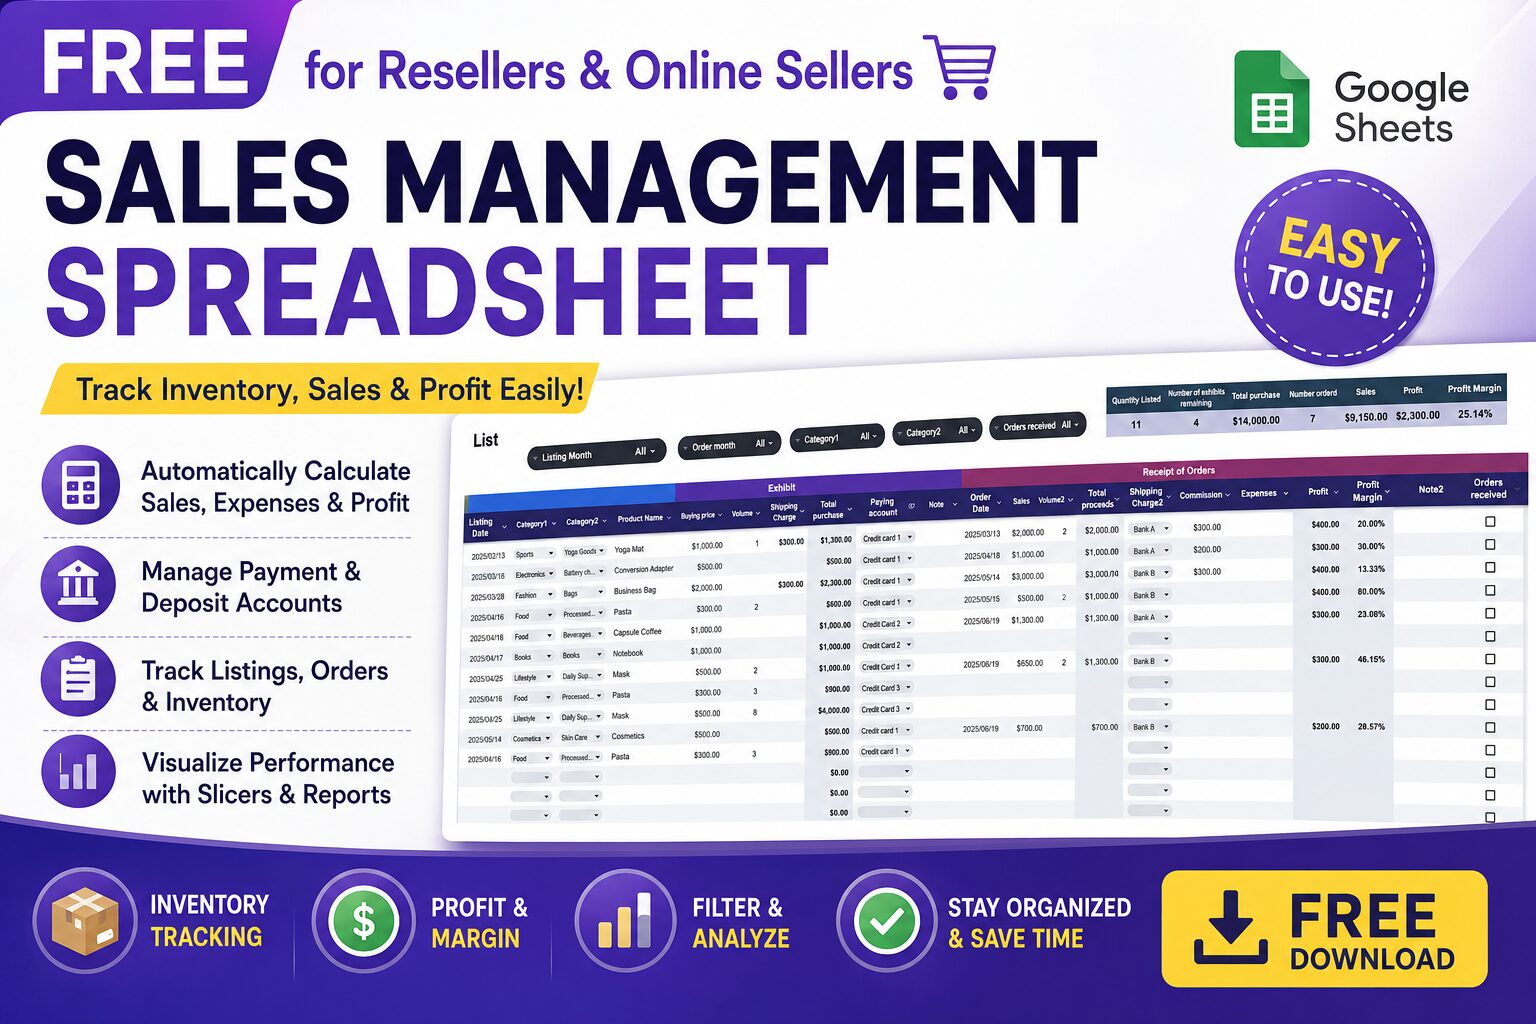
Managing sales, expenses, and inventory can be overwhelming for those running a reselling business or handling retail sales. To make this process easier, I have created a free Sales Management Spreadsheet specifically designed for sellers who purchase inventory and resell it for profit. This template is perfect for online retailers, wholesalers, and marketplace sellers on platforms like eBay, Amazon, Shopify, and more.
- Designed for Resellers – Track both your product purchases (cost of goods sold) and sales revenue.
- Monitor Profit Margins – Automatically calculates profit based on your purchase and selling price.
- Stay Organized – Keep records of inventory, transactions all in one place.
- Works for Any Retail Business – Whether you sell online or in physical stores, this template keeps your finances clear.
Key Features of the Sales Management Spreadsheet
- Automatically Calculate Sales, Expenses, and Profit!
→ Simply enter your sales, purchase costs, shipping fees, and platform fees, and the system will automatically calculate your net profit. - Manage Payment and Deposit Accounts
→ Select an account name to track monthly withdrawals and deposits easily. - Centralized Management of Listings and Orders
→ Instantly see the status of your listings and orders in one place. - Visualize Listings and Orders by Month and Category with Slicer Function
→ View listing count, sales volume, revenue, profit, and profit margin at a glance.
How to Use the Sales Management Spreadsheet
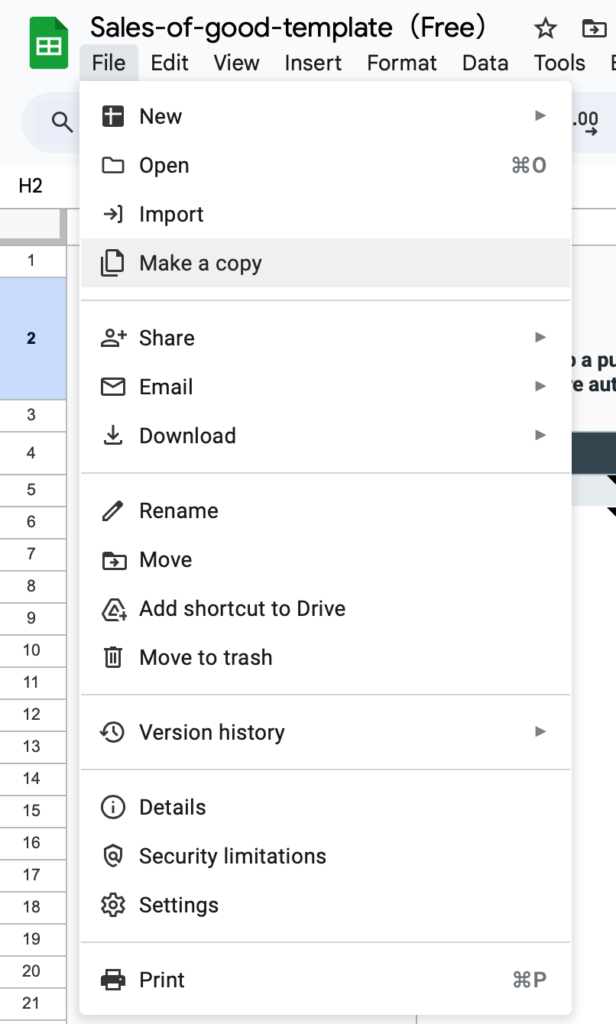
Download the template
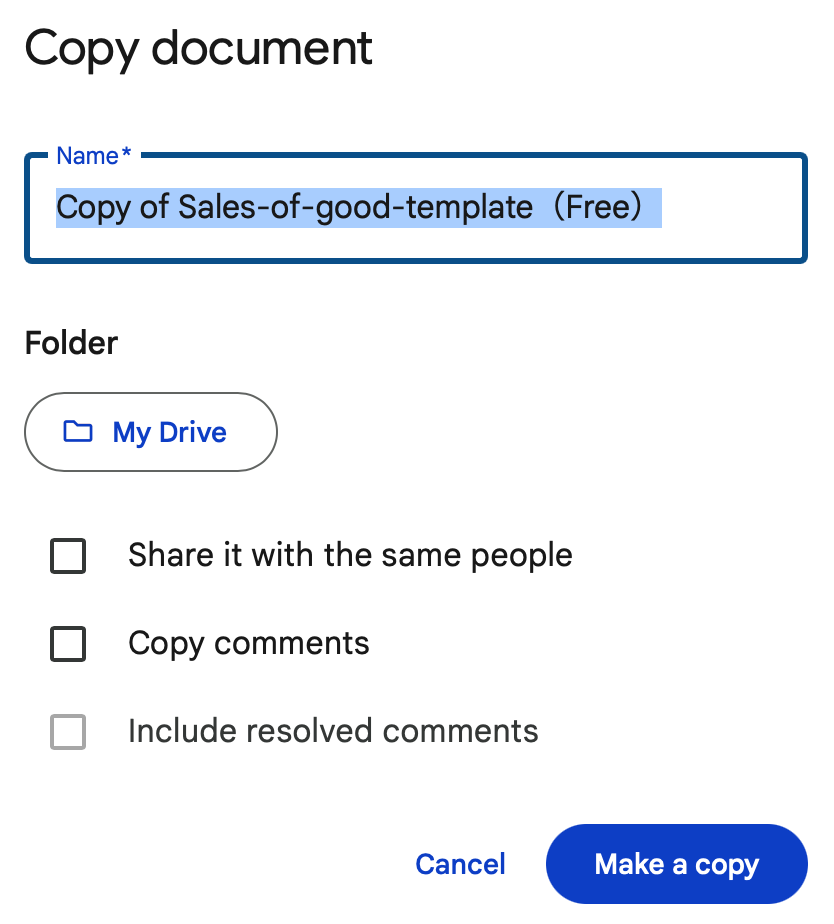
This file is for viewing only.
Please make a copy first before use.
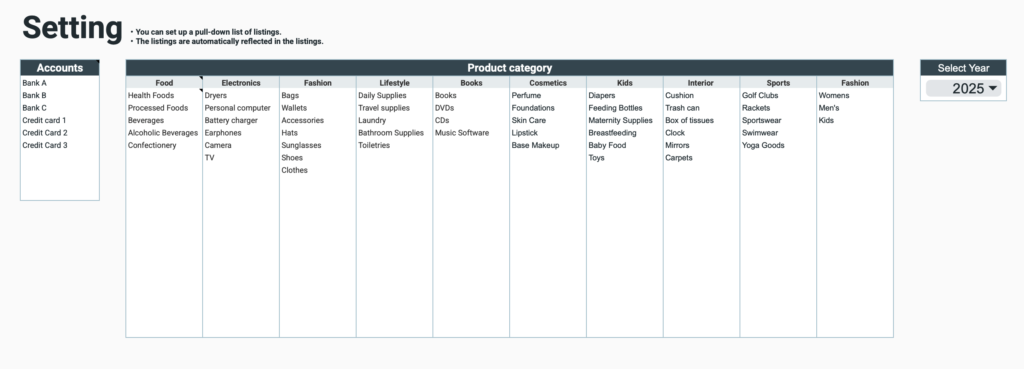
Setting
- Account Name
Enter both withdrawal and deposit accounts. - Listing Categories
Classify into main categories and subcategories. - Year Selection
Select the year from the tab.
Use one file per year.
Please choose the year you want to use.
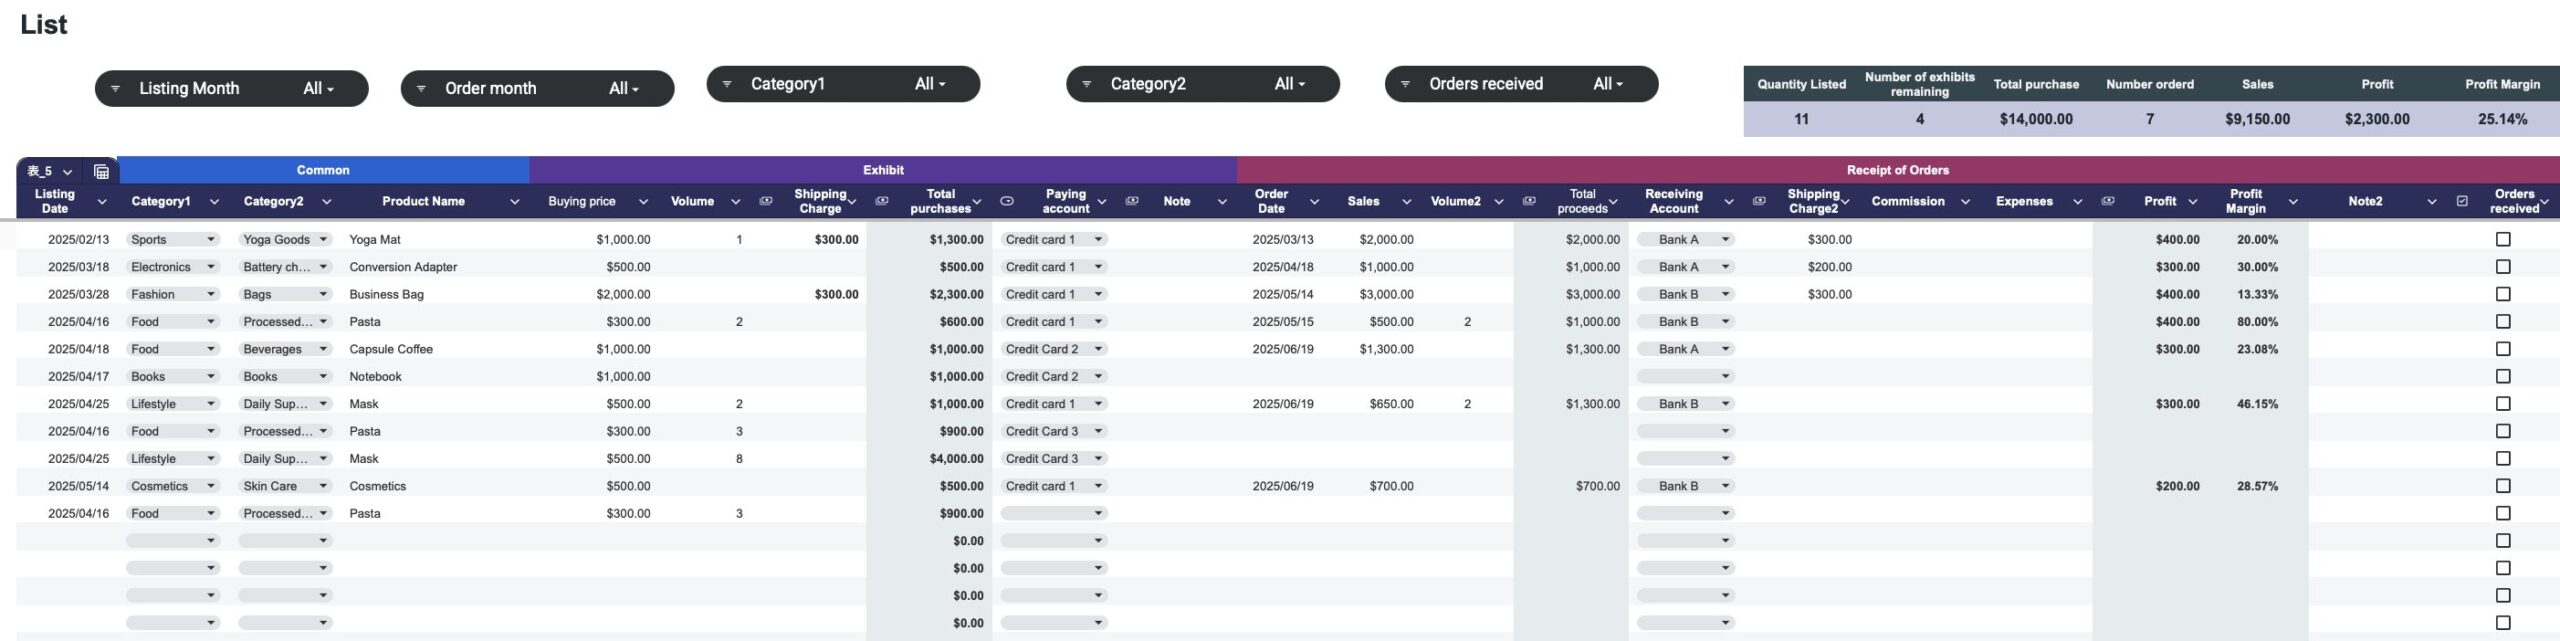
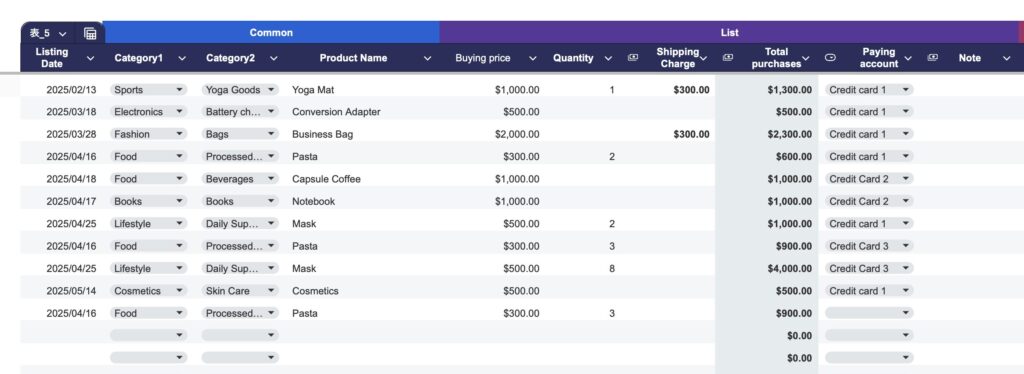
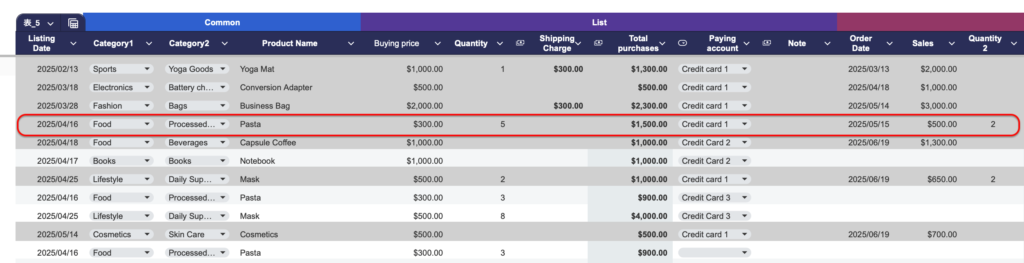
List
In the Listing Sheet, you will enter both listing and order information.
Listing Information
Input Fields
- Listing Date – Select from the calendar
- Main Category – Select from the tab
- Subcategory – Select from the tab
- Product Name
- Purchase Price
- Quantity
- Shipping Cost
- Total Purchase Cost – (Purchase Price × Quantity) + Shipping Cost 1
- Payment Account – Select from the tab
- Notes
Fields with a gray background are automatically calculated.
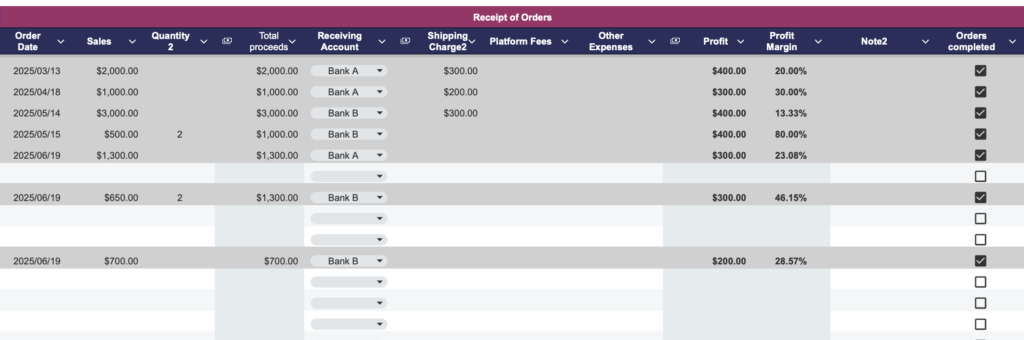
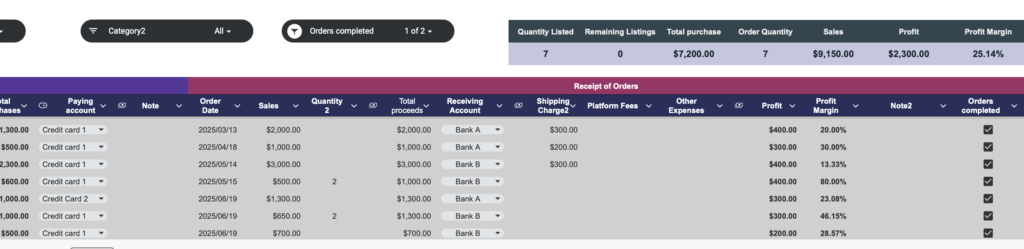
Order Information
Input Fields
- Listing Date – Select from the calendar
- Sales Price
- Quantity 2
- Total Sales – (Sales Price × Quantity 2) (automatically calculated)
- Receiving Account – Select from the tab
- Shipping Cost 2
- Platform Fees
- Other Expenses – e.g., packaging costs
- Profit – (Sales Price × Quantity 2) − (Shipping Cost 2 + Fees + Other Expenses)
- Profit Margin – Profit / Sales Price
- Notes 2
- Order Completed – Check the box when the order is completed
Items marked as completed will have a gray background.
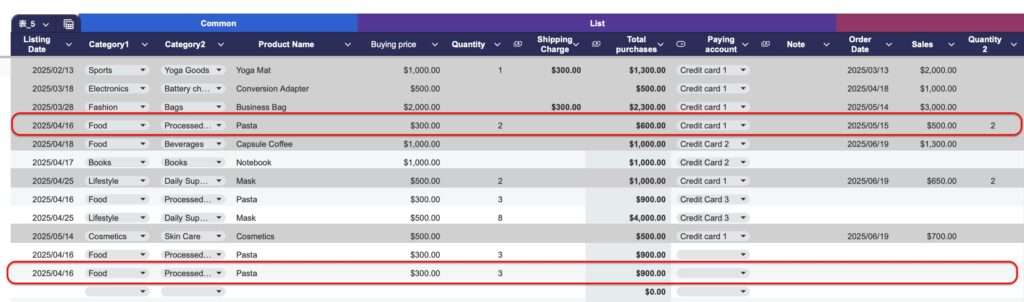
When the Listing Quantity and Order Quantity Differ
If the listing quantity and order quantity are different, please adjust the listing to match the order quantity first.
Copy the listing information and paste it into a new row in the list.
Then, enter the remaining quantity separately.
Slicer
You can use the slicer function to display specific items based on selected criteria.
Slicer Options
- Listing Month
- Order Month
- Main Category
- Subcategory
- Order Completed
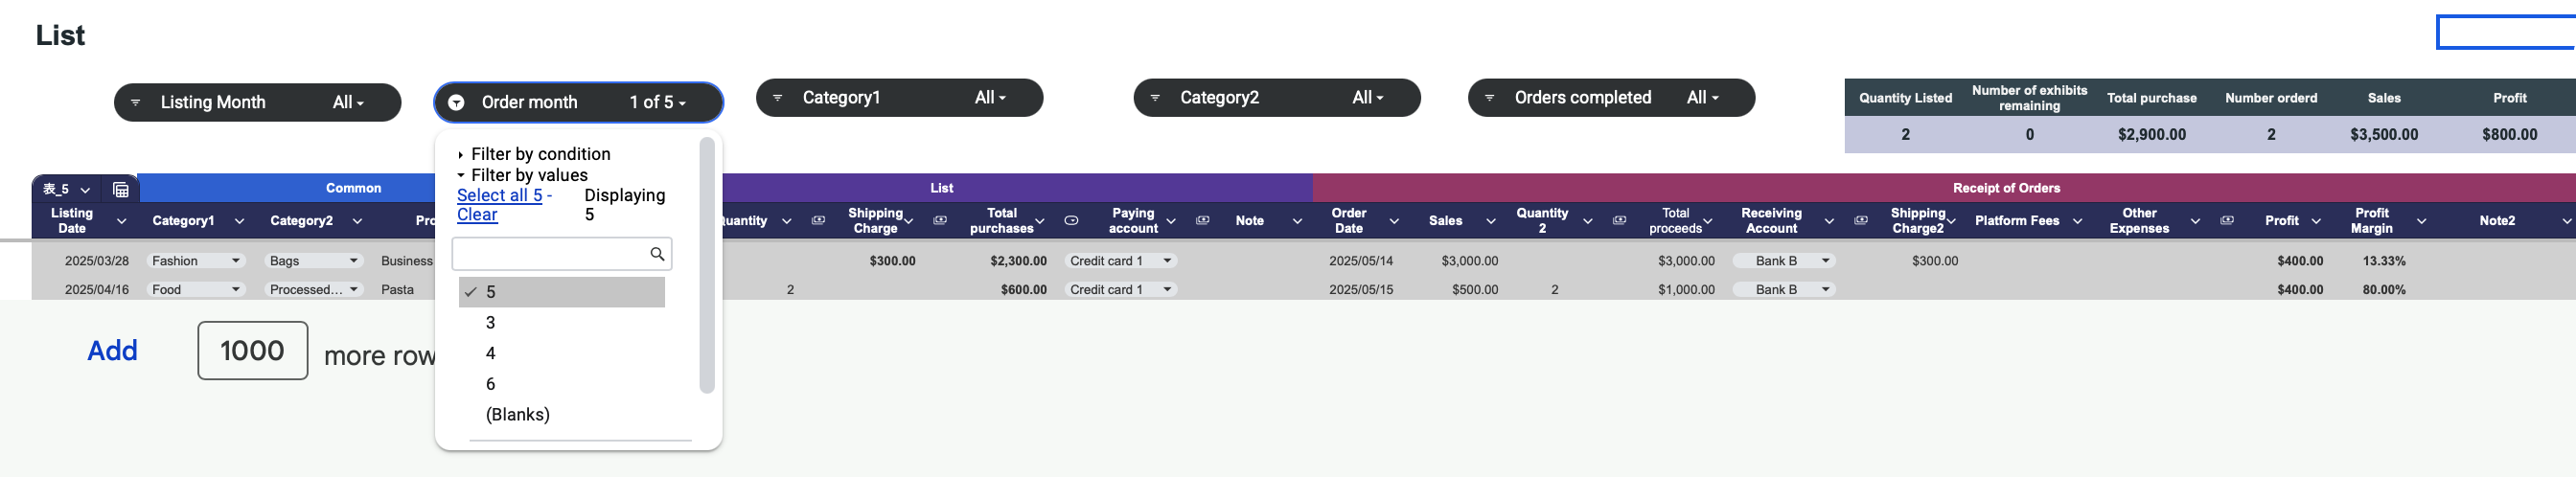
In the Order Completed slicer, you can filter to display only completed or only pending orders.
- TRUE – Items with the checkbox checked (completed)
- FALSE – Items without the checkbox checked (not yet completed)

Display of Totals
The totals are displayed at the top of the list.
Displayed Items
- Number of Listings
- Remaining Listings
- Total Purchase Cost
- Number of Orders
- Total Sales
- Total Profit
- Profit Margin
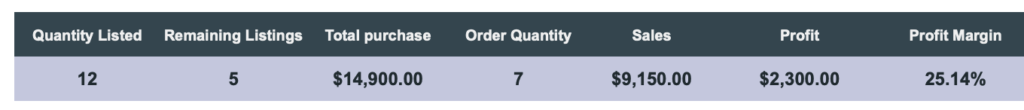
When you filter specific items using the slicer, the totals displayed will reflect only the visible (filtered) items.
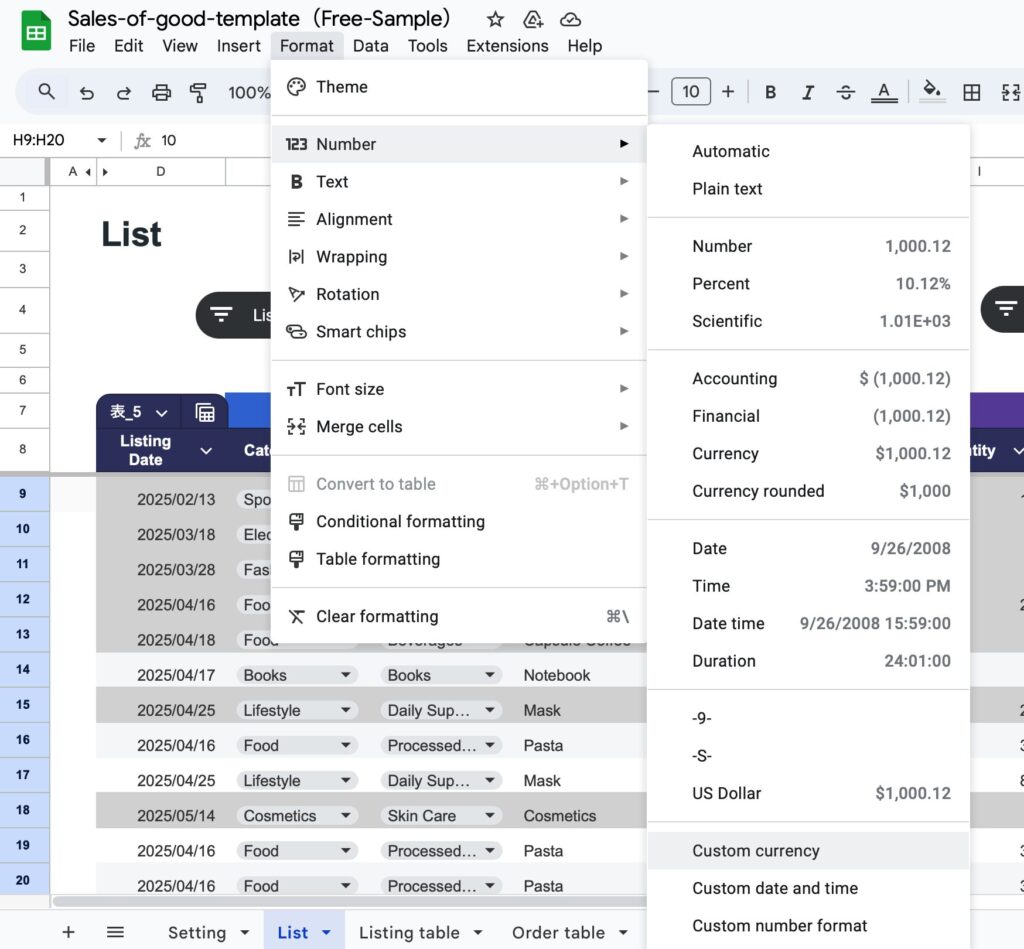
How to change currency units
The default currency unit is the dollar.
To change the currency unit, specify a range, and click Format,Number,Custom currency.
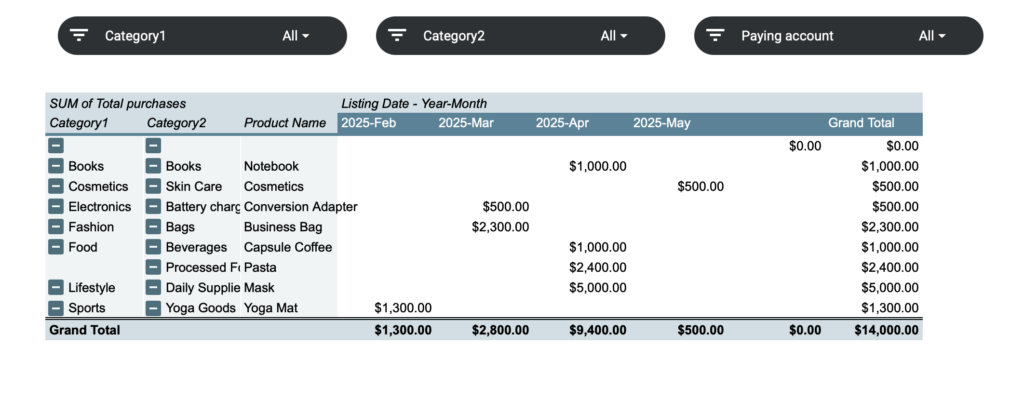
List table
The total purchase cost of listed items can be viewed by month and by category using filters or slicers.
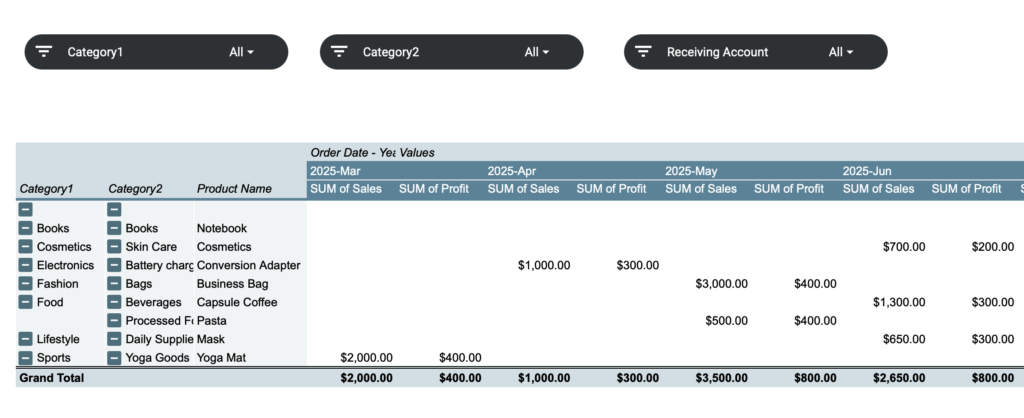
Sales table
Sales and profit from order records can be viewed by month and by category using filters or slicers.
Free Download
This file is for viewing only.
Please “copy and save” the file before use.